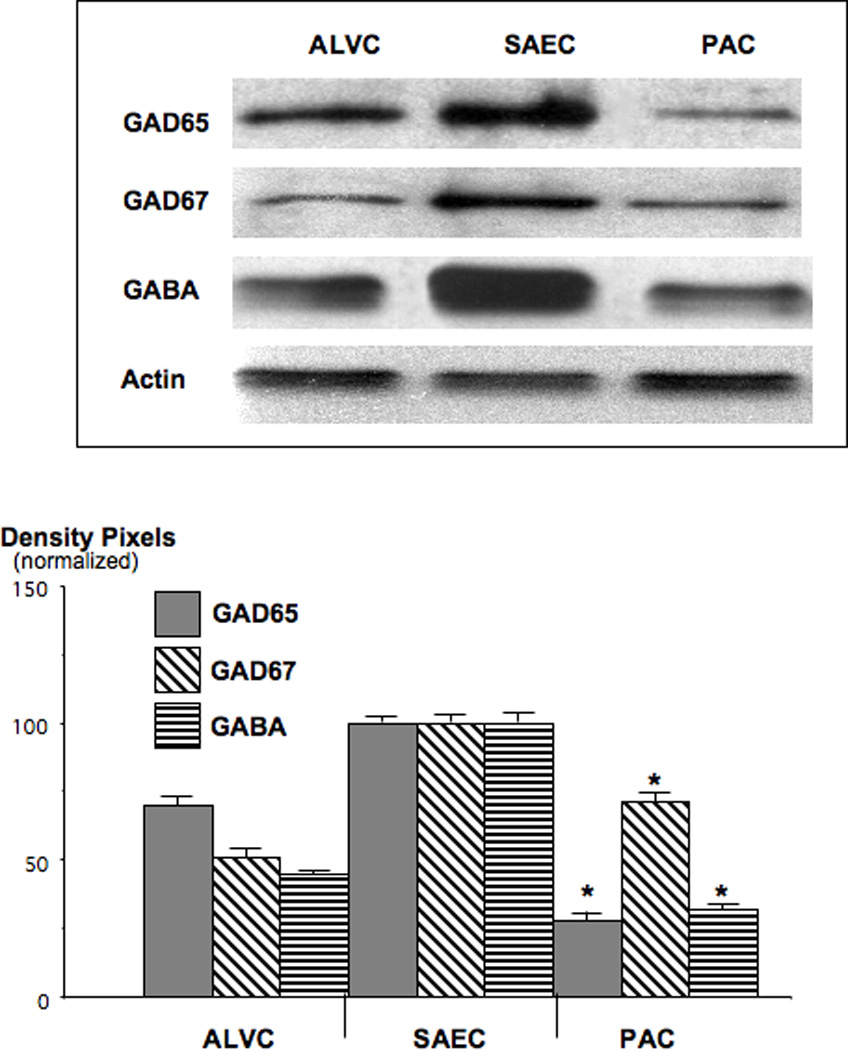
Figure 4.

Western blots, exemplifying the suppression of GAD and GABA in NNK-induced PAC. GAD65 was reduced to 25% (*: p<0.001) and GABA to 26% (*: p<0.001) of the levels observed in SAECs. Data in the graph are normalized (expression levels in SAEC=100%) mean values and standard errors of ratios of GAD or GABA over actin from five densitometric readings per band. Each Western blot was conducted three times with similar data.
