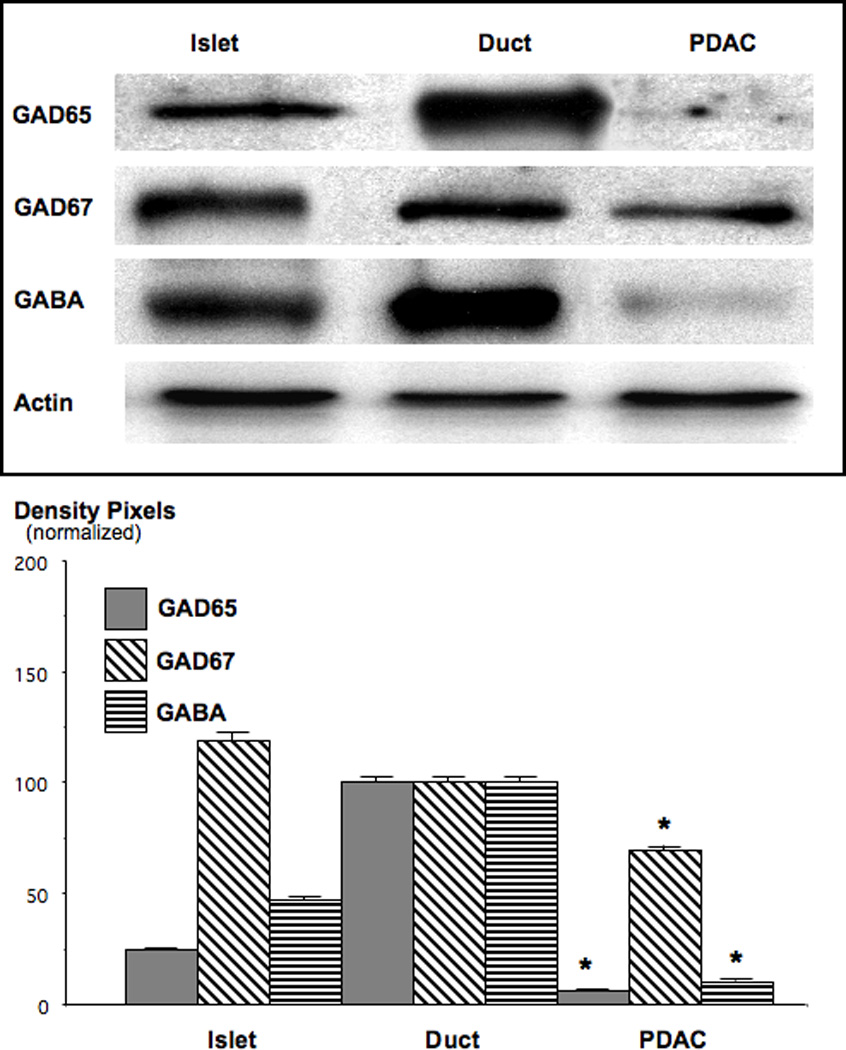
Figure 7.

Western blots, exemplifying the suppression of GAD and GABA in NNK-induced PDAC. Both, GAD65 and GABA were reduced to barely detectable levels of below 10% of control duct epithelial cells (*: p<0.001). Quantitative data in the graph are mean values and standard errors of ratios of GAD or GABA over actin and are normalized with levels in duct epithelial cells set at 100%. Each Western blot was conducted three times with similar results.
