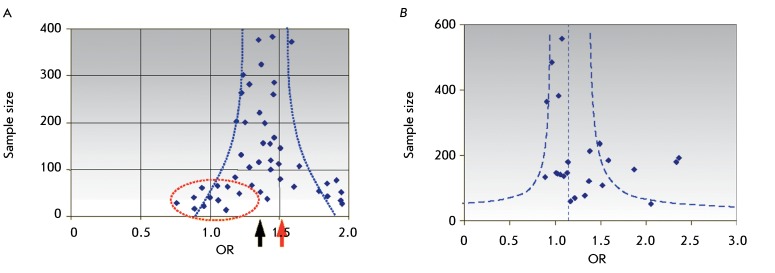
Fig. 4.
Dependence of the effect intensity (OR) on the composition of the samples selected for the meta-analysis (funnel plot). The strong asymmetry of this plot may indicate publication bias. (A) – The hypothetic distribution of the studies over the size of the samples studied and effect intensity. For the elimination of less willingly published results obtained using small samples with weak effects (dots in a dashed oval), the OR value turns out to be overestimated (red arrow) with respect to the real OR (black arrow). (B) – Distribution of the studies over sample size and effect intensity for 25 publications selected for the meta-analysis in this study (insignificant asymmetry).

