
Figure 5.
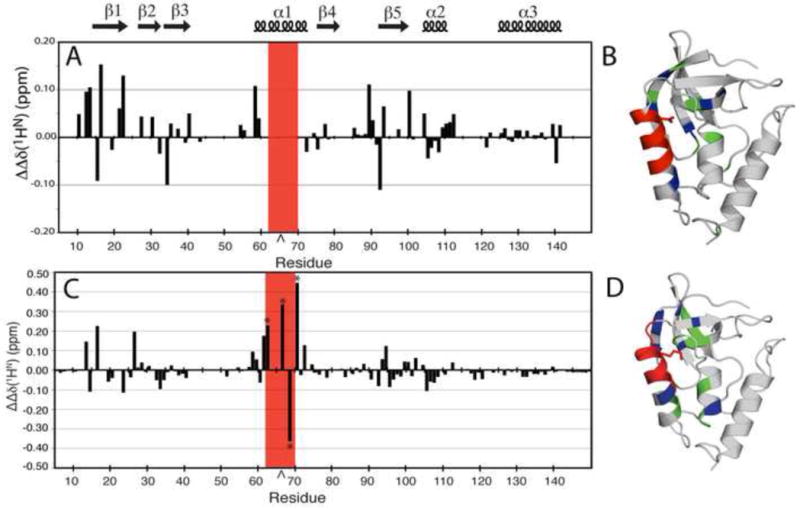
(A) ΔΔδ(1HN) plotted by residue for Δ+PHS/V66D at pH 7.9 and 9.9. This represents the difference in changes in the 1H, 15N HSQC spectrum of the reference protein, Δ+PHS, at pH 7.9 and 9.9, and the Δ+PHS/V66D variant. The caret indicates the site of the substitution. The red box indicates resonances that were broadened in the mutant but not in the background by increasing pH. (B) Structural distribution of the largest ΔΔδ(1HN) (≥ 0.1 ppm) (blue) and moderate ΔΔδ(1HN) (≥ 0.05 and < 0.1 ppm) (green). Exchange broadened resonances (red) in the Δ+PHS/V66D structure. (C) ΔΔδ(1HN) plotted by residue for Δ+PHS/V66K at pH 6.7 and 4.6. This represents the difference in changes in the 1H, 15N HSQC spectrum of the background protein, Δ+PHS and its V66K variant, between the two pH values. The asterisks identify resonances recorded at 32°C. The caret indicates the site of the substitution. (D) Structural distribution of the largest ΔΔδ(1HN) (≥ 0.1 ppm) (blue), and moderate ΔΔδ(1HN) (≥ 0.05 ppm and < 0.1 ppm) (green) in the Δ+PHS/V66K structure. Upon ionization of Lys-66, positions 62–70 exhibit extreme line-broadening (red). Within this broadened subset, very large ⊗⊗δ(1HN) values (> ±0.2 ppm) were measured at positions 62, 66, 68, and 70.