
Figure 4.
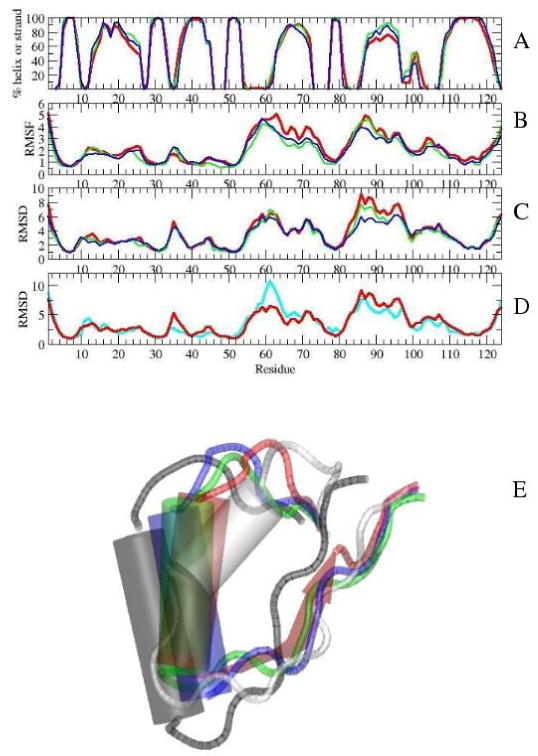
Top: Average properties during the 7th ns of simulations with (red), (green), and (blue): A) secondary structure, B) RMSFs of average structures of individual simulations, C) RMSDs from the initial structure. D) RMSD values of the simulations from the initial structures of (red) and I-NtrCr (cyan). E) Position of helix α4 in initial NMR structures of (gray) and I-NtrCr (white), and in average structures of (red), (green), and (blue). The positions were plotted after residues 5-55 were aligned in VMD [39].