
Figure 8.
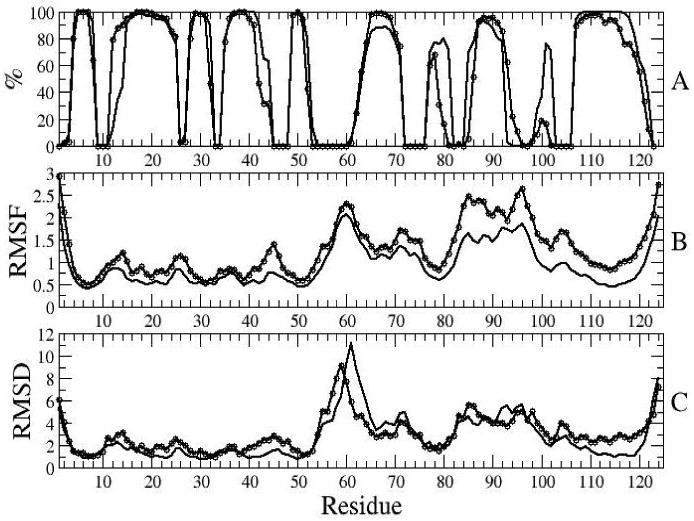
Comparison of simulations started from the average minimized NMR structure of the inactive form (1DC7, full line) with simulations started from the first structure of the ensemble of NMR structures of the inactive form (1NTR, line with circles). Average properties during 4th ns of simulation: secondary structure (A), RMSFs (B), and RMSDs from the initial structure (C).