
Figure 2.
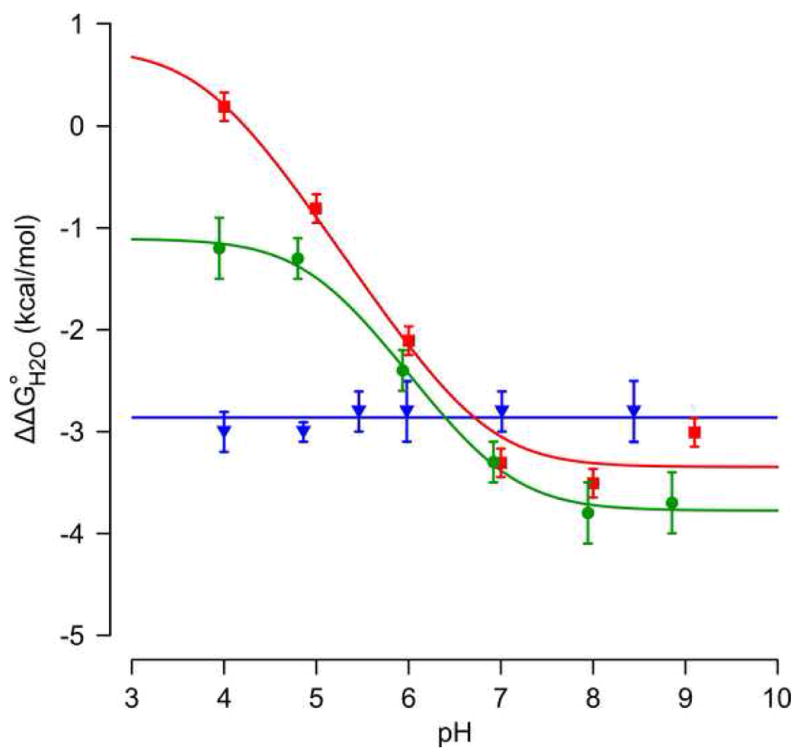
pH-dependence of ΔΔG°H2O for the Δ+PHS/L38D (
 ), Δ+PHS/L38E (
 ), and Δ+PHS/L38K (
 ) variants. Solid lines are fits to the data (see methods). Error bars are propagated from GdnHCl denaturation fit errors.
Official websites use .gov
A
.gov website belongs to an official
government organization in the United States.
Secure .gov websites use HTTPS
A lock (
) or https:// means you've safely
connected to the .gov website. Share sensitive
information only on official, secure websites.
pH-dependence of ΔΔG°H2O for the Δ+PHS/L38D (
), Δ+PHS/L38E (
), and Δ+PHS/L38K (
) variants. Solid lines are fits to the data (see methods). Error bars are propagated from GdnHCl denaturation fit errors.