
Figure 4.
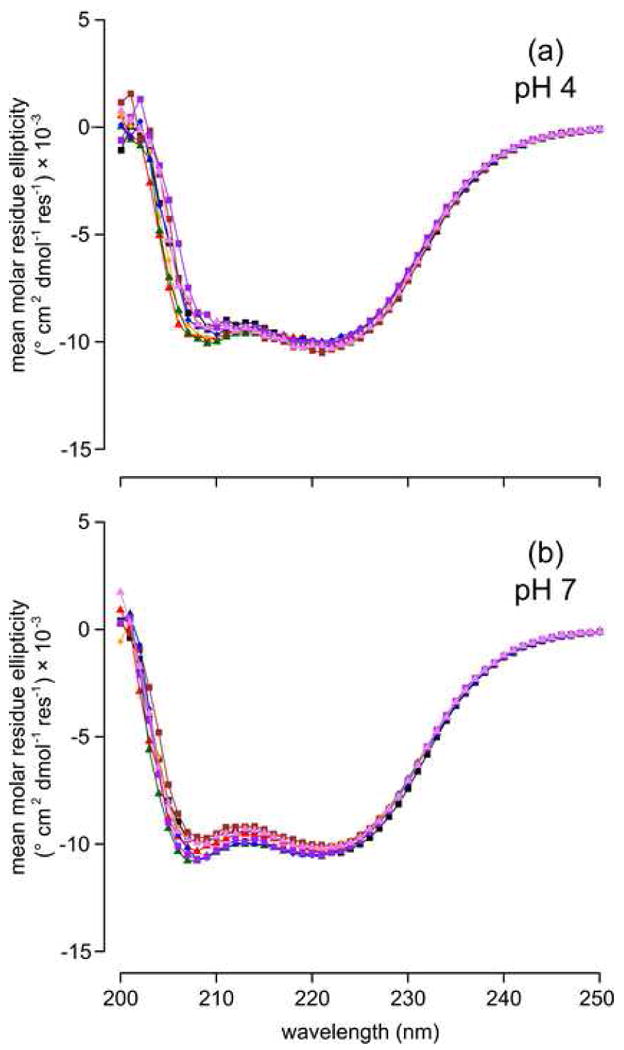
Far-UV CD spectra of at pH 4 (A) and pH 7 (B). Series are Δ+PHS (▾), Δ+PHS/L38E (
 ), Δ+PHS/L38E/D77N (
 ), Δ+PHS/L38E/E122Q (
 ), Δ+PHS/L38E/E122D (
 ), Δ+PHS/L38E/R126Q (
 ), Δ+PHS/L38D (
 ), and Δ+PHS/L38D/E122Q (
 ).
).
Official websites use .gov
A
.gov website belongs to an official
government organization in the United States.
Secure .gov websites use HTTPS
A lock (
) or https:// means you've safely
connected to the .gov website. Share sensitive
information only on official, secure websites.
Far-UV CD spectra of at pH 4 (A) and pH 7 (B). Series are Δ+PHS (▾), Δ+PHS/L38E (
), Δ+PHS/L38E/D77N (
), Δ+PHS/L38E/E122Q (
), Δ+PHS/L38E/E122D (
), Δ+PHS/L38E/R126Q (
), Δ+PHS/L38D (
), and Δ+PHS/L38D/E122Q (
).