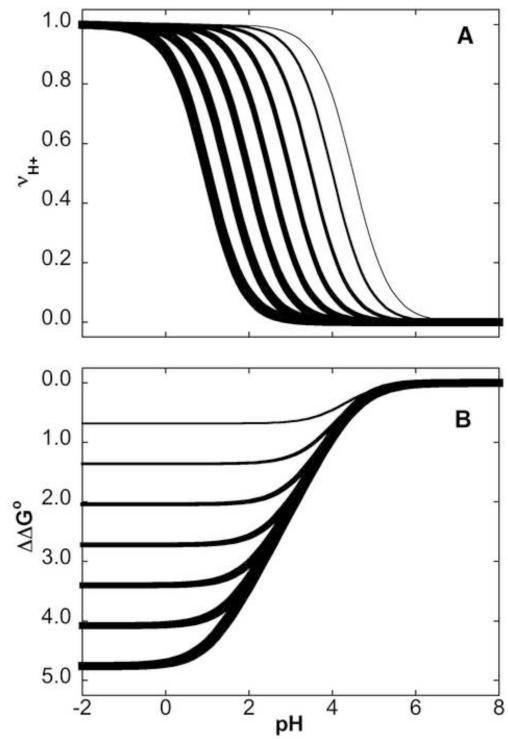
FIGURE 1.
Gibbs free energy related to shifts in pKa values of a single H+ binding site (A) Simulated H+ binding curves for a carboxylic group with pKa = 4.5 (thinnest), 4.0, 3.5, 3.0, 2.5, 2.0, 1.5 and 1.0 (thickest). (B) ΔΔG° reflected in shifts in pKa values, calculated by integration (with Equation 13) of the area between the reference curve with pKa of 4.5 and the other curves in 1A for groups with depressed pKa values.

