FIGURE 2.
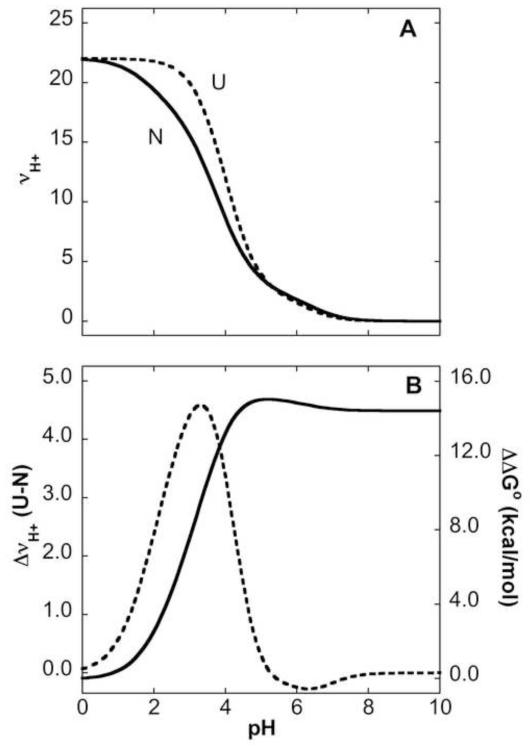
pH dependence of Gibbs free energy related to shifts in pKa values. (A) Simulated H+ binding curves for the native (N) state (solid line) calculated with pKa values for Asp, Glu and His residues measured with NMR spectroscopy. Simulated H+ binding curves for the unfolded (U) state (dashed line) calculated with pKa values of 3.7, 4.2 and 6.3 for Asp, Glu and His, respectively. These values were obtained by analysis of the H+ binding curve of unfolded SNase in water measured with direct potentiometric methods 30. Contributions from Lys, Arg and N and C termini were not included in these calculations. (B) Preferential H+ binding (Δmoles H+ bound, dashed line with reference to left axis)) calculated as moles H+ bound in U – moles H+ bound in N). ΔΔG° (solid line with reference to right axis) calculated as the area under the Δmoles H+ bound vs pH curve.

