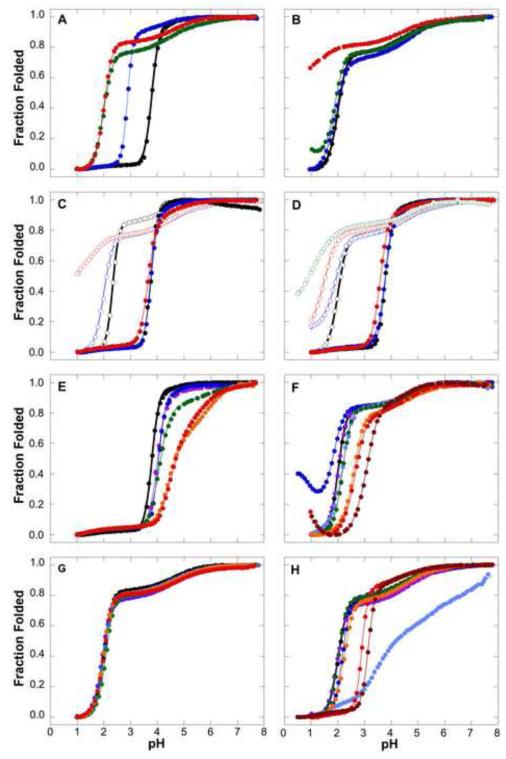
FIGURE 4.
H+ titration curves of SNase and SNase variants monitored with Trp fluorescence. All data measured at 298 K in 100 mM KCl unless otherwise noted. Solid lines correspond to fits with 2 or 3 state unfolding models, as described previously7. (A) Dependence of acid unfolding on global thermodynamic stability. Data for the wild-type (Black), PHS (Blue), Δ+PHS (Green) and Δ+VIAGLA (Red) variants are shown. All data measured at 298 K in 100 mM KCl. (B) Effects of stabilizing osmolytes on acid unfolding of Δ+PHS SNase in 100 mM KCl (Black), 300 mM TMAO (Blue), 1 M glycerol (Green) and 1.5 M sucrose (Red) are shown. (C) Effects of salt on acid unfolding of wild-type and Δ+PHS SNase. Curves for the wild-type (solid symbols) and Δ+PHS SNase (open symbols) in 10 mM KCl (Black), 100 mM (Blue) and 1 M (Red) are shown. (D) Specific salt effects on the acid unfolding of wild-type and Δ+PHS SNase. Curves for the wild-type (solid symbols) and Δ+PHS SNase (open symbols) in 100 mM KCl (Black), with 100 mM KClO4 (Blue), 50 mM (NH4) 2SO4 (Red) and 300 mM (NH4)2SO4 (Green) are shown. (E) Acid unfolding in variants of wild-type SNase where Asp or Glu residues have been neutralized through substitution to Ala. Curves for the wild-type (Black), E10A (Purple), D19A (Blue), D77A (Green), D83A (Orange) and D95A (Red) proteins are shown. (F) Acid unfolding of variants of Δ+VIAGLA SNase where Asp or Glu residues have been neutralized through substitution to Asn or Gln. Curves for Δ+VIAGLA (Black), E10Q (Purple), D19N (Dark Blue), D83N (Light Blue), D95N (Green), D77N/D83N (Orange), E10Q/D19N/D77N/D83N (Red) and E10Q/D19N/D77N/D83N/D95N (Red) variants are shown. (G) Acid unfolding of variants of Δ+VIAGLA SNase where Lys or His residues have been neutralized through substitution to Gln. Curves for Δ+VIAGLA (Black), H8Q (Dark Blue), K16Q (Light Blue), K63Q(Green), K71Q (Orange), and K134Q (Red) variants are shown. (H) H+ titration curves monitored with Trp fluorescence in variants of Δ+PHS SNase where various residues have been neutralized through substitution to Asn or Gln. Curves for Δ+PHS (Black), D19N (Purple), D21N (Blue), E57Q (Light Blue), E135Q (Green), R35Q (Orange), R87Q (Red), and R35Q/R87Q (Brown) variants are shown.

