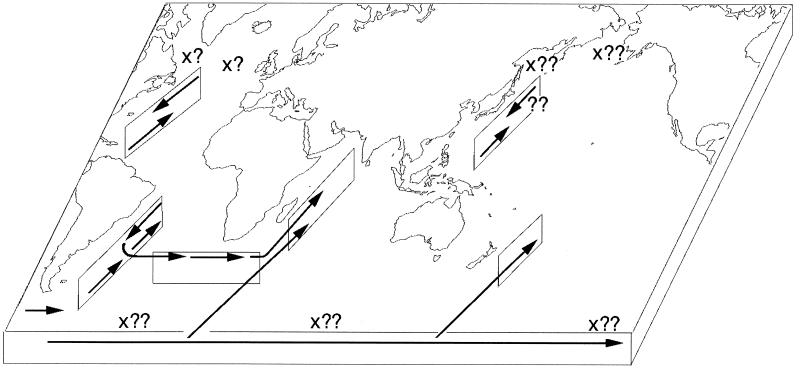
Figure 1.
Schematic diagram of global deep water circulation during the LGM. Parallelograms represent hydrographic sections, divided into upper deep and lower deep circulations, as indicated by arrows. x, marks a possible site of sinking; ?, a certain regional source whose specific formation site is unknown; ??, a questionable source.

