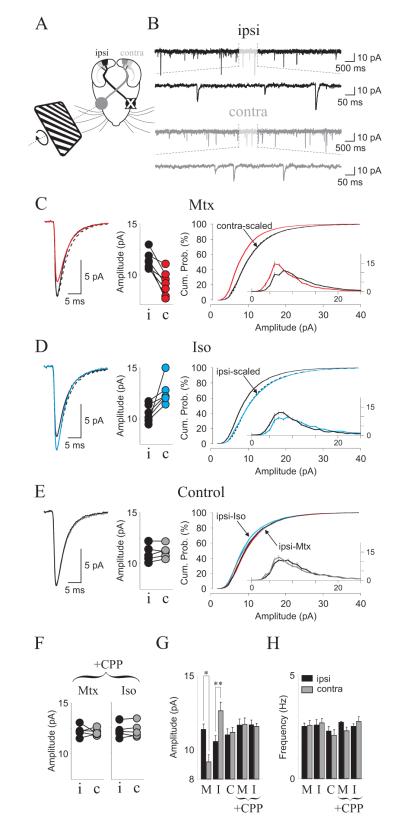
Figure 7. Neuromodulators gate experience-dependent synaptic scaling of mEPSCs from visually stimulated cortex.
(A) Experimental diagram. Prior to recording, rats were injected with isoprorenol or methoxamine (15 mg/kg. i.p.) and subjected to 1 hour of monocular stimulation with drifting gratings (see methods). (B) Example mEPSCs from pyramidal neurons located in contralateral (contra) and ipsilateral (ipsi) hemispheres of a Mtx-treated animal. (C-E) Results obtained in animal treated with methoxamine (C), isoproterenol (D) or control vehicle solution (E). In each case the left panels show the average mEPSCs recorded from contralateral (stimulated, thick colored line) and ipsilateral (non-stimulated, thin black line) hemispheres superimposed with a scaled mEPSC (dashed line); the center panels show the average mEPSC amplitudes from contralateral (black filled dots) and ipsilateral (colored filled dots) hemispheres obtained from each rat (data connected by a straight line); the right panels show the cumulative distribution of mEPSC amplitude for contralateral (thick colored line) and ipsilateral (thin line) hemispheres and scaled distribution (dashed line). The inset shows mEPSC distributions. (F) CPP injection blocks the changes in average mEPSC amplitude in the stimulated cortex induced by methoxamibne (left) or Isoproterenol (right). (G-H) summary plots for average mEPSC amplitude (G) and frequency (H).

