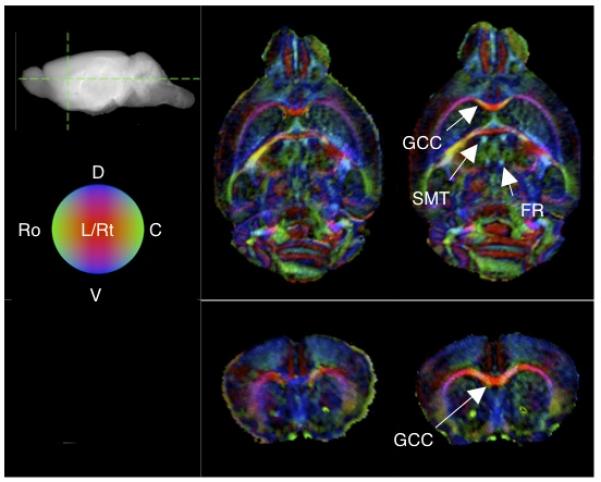
Figure 3.

DTI visualization of mouse brain white matter structures. Slices displayed correspond to RGB-coded coronal and axial sections (locations shown on the sagital projection of the brain) obtained for uncorrected (left) and registered (right) DTI datasets from a representative specimen. The brightness is weighted by the FA anisotropy index, and the red, green and blue colors respectively represent orientation components in the left-right (L-Rt), rostral-caudal (Ro-C), and ventral-dorsal (V-D) axes, as indicated by the legend sphere. Compared to the unregistered case (top), the registered dataset (bottom) shows overall visibly sharper, brighter and more uniformly oriented white matter structures. The labeled white matter structures are the genu of the corpus callosum (GCC), stria medullaris thalami (SMT) and fasciculus retroflexus (FR).
