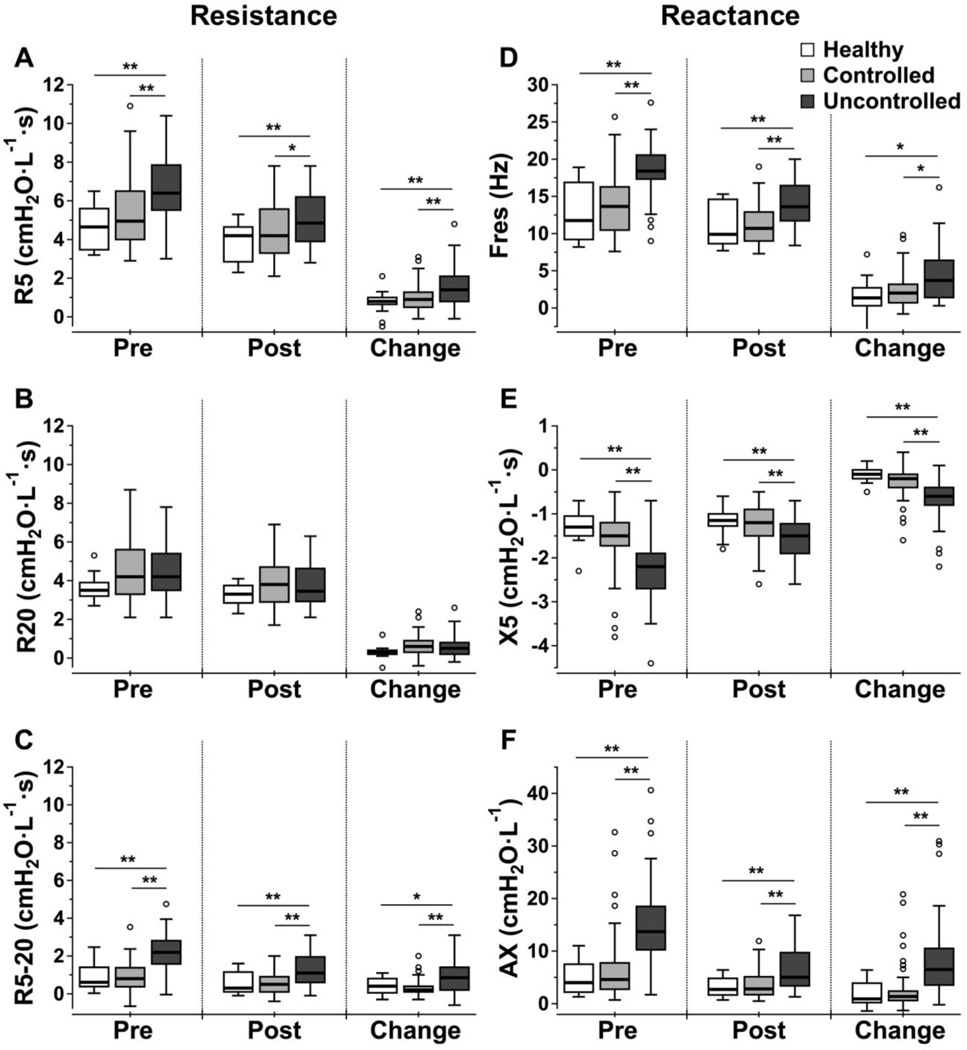
FIG 2.
Box plots of IOS measurements (A. R5, B. R20, C. R5-20, D. Fres, E. X5 and F. AX) for different asthma groups before, after bronchodilator and the bronchodilator response. The boxes represent 25th –75th percentile with median, and the top and bottom tails represent the highest/lowest scores without outliers. An outlier is defined as any value that lies more than 1.5 times the interquartile range from either end of the box. Significance level of group difference using unpaired Mann-Whitney U test: * P-value < .05; ** P-value < .01.

