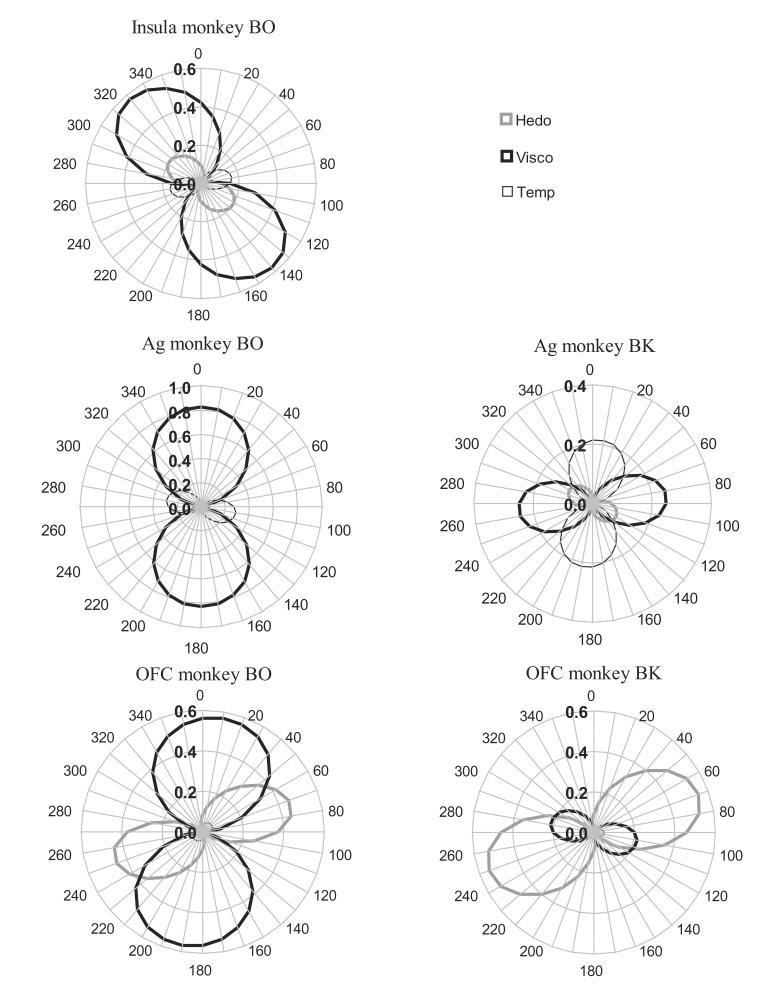
Fig. 3.
To complement the individual neuronal-level analysis of Fig. 2, this figure provides a novel population-level analysis between the locations of stimuli on a 2-dimensional scale (MDS, a means to visualize neural population representation of stimuli; Systat v. 10, SPSS Inc.) and behavioral acceptability ratings (“Hedo”), and additionally between these locations and stimulus viscosity (“Visco”) and stimulus temperature (“Temp”). The five MDSs were based on stimulus response similarity as quantified by the Pearson correlation coefficient of the neural responses the stimuli evoked in each population. The figure shows for each area and monkey the r2 (the proportion of the variance explained) of the correlation (r) between stimulus location and these three factors as a function of the rotation of the MDS (no behavioral acceptiblity data was available for insula in monkey BK). Note that rotation of the MDS, as well as scaling, inversion and translation, yield equivalent MDS solutions. In all three neural areas of monkey BO viscosity correlated highly with MDS stimulus position (see Table 1 for details). Importantly, only at the level of the OFC did the behavioral acceptablity of stimuli (measured and analyzed separately for each monkey) correlate highly with the neural representation of the stimuli.

