Fig. 4.
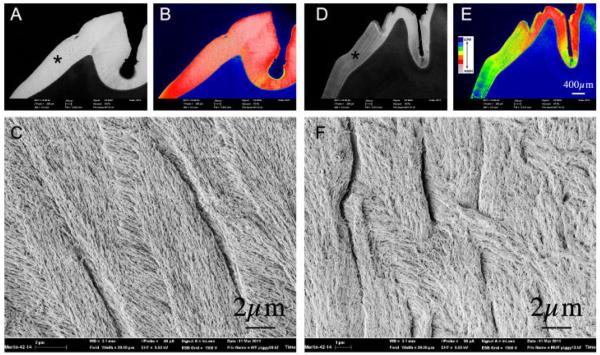
BSE-SEM and FE-SEM imaging of the permanent maxillary left first molar of a 6-month-old wild-type domestic pig (Parts A–C) compared toa1 2-month-old cystic fibrosis (Cftr-DF508) pig (PartsD–F).Low magnification BSE-SEM images of WT and Cftr-DF508 molars are provided in Parts A and D, respectively, both images of which were acquired under identical signal intensity settings. Scale for both is included in Part D. These images were subject to an 8-bin color look-up-table (Parts B and E) for visual comparison to represent differences in mineralization density between samples (see color code insert: wherein cool colors—blue, green, yellow denote lower mineralization density and hot colors—gray, pink, red represent higher mineralization densities). Asterisks on Parts A and D indicate areas shown in Parts C and F imaged at higher magnification (FW = 20 μm) by FE-SEM. Parts C and F represent WT and Cftr-DF508 molars, respectively, showing abnormal crystal growth in the latter as imaged in secondary electron emission mode.

