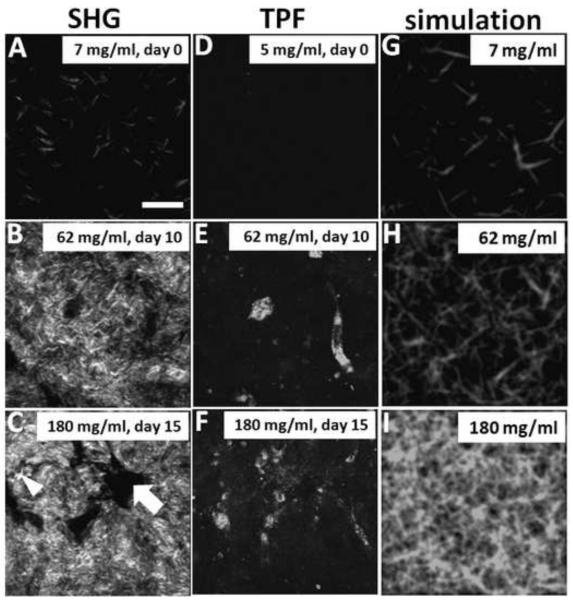
Figure 2.
Images of SHG signal (A-C), TPF signal (D-F) from cellularized gels, and simulated signal from a randomly-oriented fiber network of similar texture to the SHG images (G-I). The SHG and TPF images are from cellularized gels at three stages of contraction during floating culture, and the simulated images are of roughly corresponding collagen fiber density. Estimated collagen concentration for each gel/image is indicated, and the days of culture. Bar represents 50 μm.

