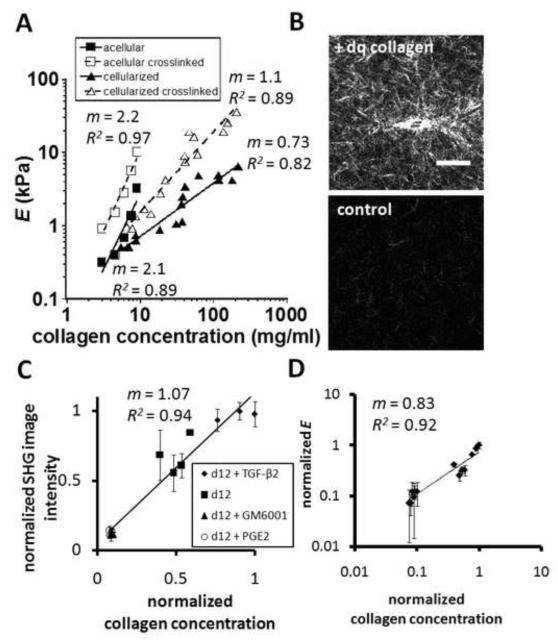
Figure 4.
(A) E measured from uncrosslinked cellularized gels (◻, n = 16), glutaraldehyde crosslinked cellularized gels (◻, n = 16), uncrosslinked acellular gels (◻, n = 5), and crosslinked acellular gels (◻, n = 5) as functions of collagen concentration. E data points represent five averaged measurements per gel. Error bars are omitted for clarity. Lines represent linear best-fits to the log-transformed data (averaged over coarse and fine-structured gels). Best-fit slopes and R2 values are indicated next to best-fit lines. (B) Representative confocal fluorescence images of cellularized gels polymerized with DQ collagen (upper panel) and without DQ collagen (lower panel) and incubated for 7 days. Scale bar is 50 μm. (C) Normalized mean SHG image intensity versus normalized collagen concentration for cellularized gels incubated for 12 days (d12) in DMEM+10% FBS supplemented with 2 ng/ml TGF-β2, 35 pg/ml PGE2, or 10 μM GM6001. (D) Normalized E versus normalized collagen concentration for the same gels, determined by indentation testing as in (A). Slopes and best-fit coefficients are indicated in the figure.

