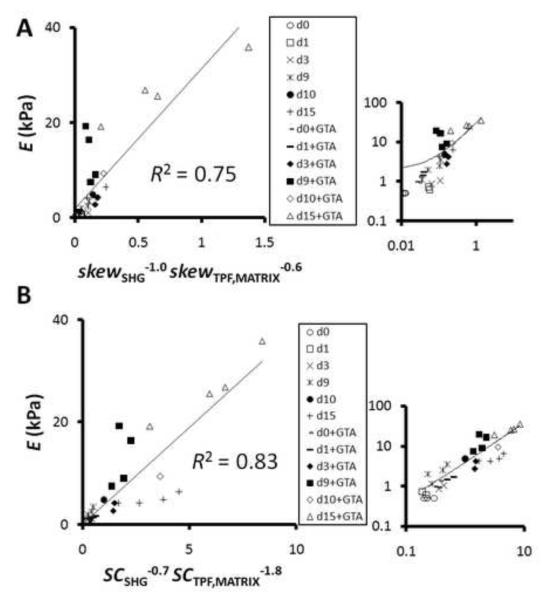
Figure 5.
(A) Nonlinear best-fit model for E on SHG signal skewness and matrix-derived TPF signal skewness. Markers indicate days in culture of the collagen gels and presence of GTA crosslinking. The inset on the right is a loglog plot of the data. (B) Nonlinear best-fit model for E on SHG signal speckle contrast and matrix-derived TPF signal speckle contrast. Markers indicate days (notation “d1” for day 1) in culture of the collagen gels and presence of GTA crosslinking. The inset on the right is a log-log plot of the data. Power-law best-fit exponents and R2 values are indicated in the figure. E was averaged from five measurements per gel for n = 16 gels.

