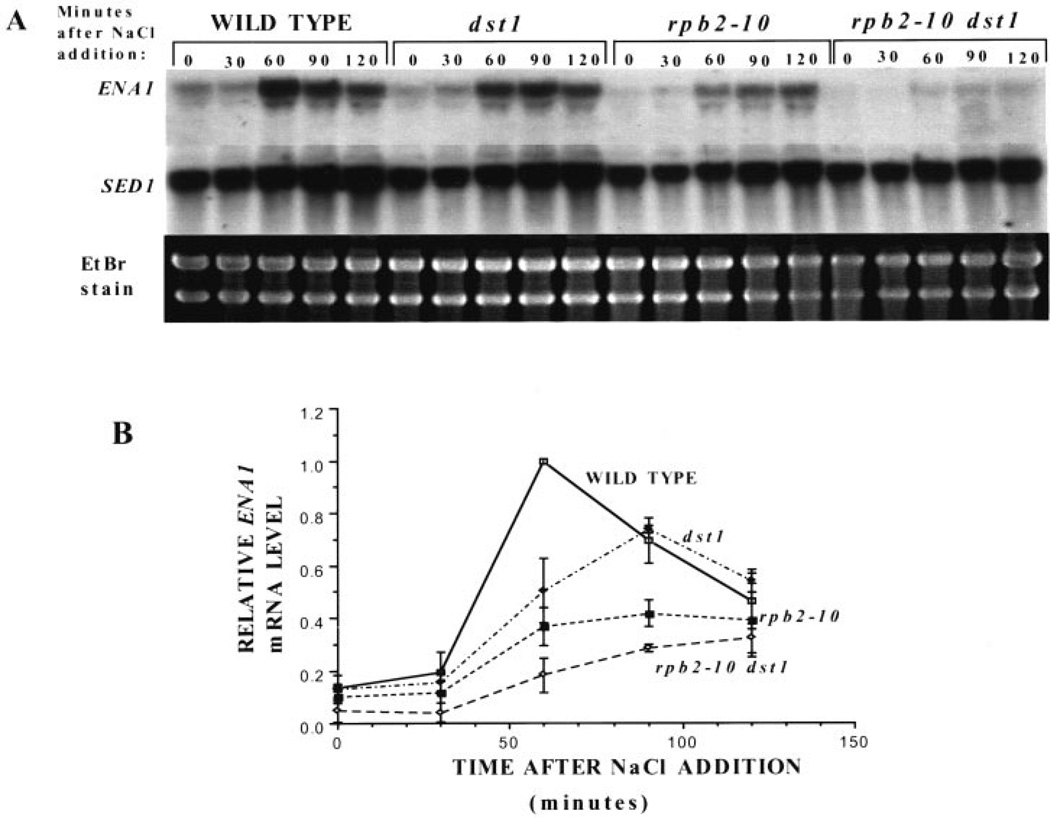
Fig. 1. Induction of ENA1 in wild-type and mutant yeast strains.
A, RNA from DY103 (WILD TYPE), DY106 (dst1), DY105 (rpb2–10), and DY108 (rpb2–10 dst1) cells were taken at the time points indicated following addition of NaCl (1 m) to the medium. Blots were probed with a portion of the ENA1 gene, and results from three separate experiments were quantitated using a PhosphorImager. ENA1 transcript levels were corrected for background levels of the same area for each sample lane. These values were divided by the maximal level of ENA1 transcript present in wild-type at 60 min, and the means and standard deviations (error bars) were plotted (B).

