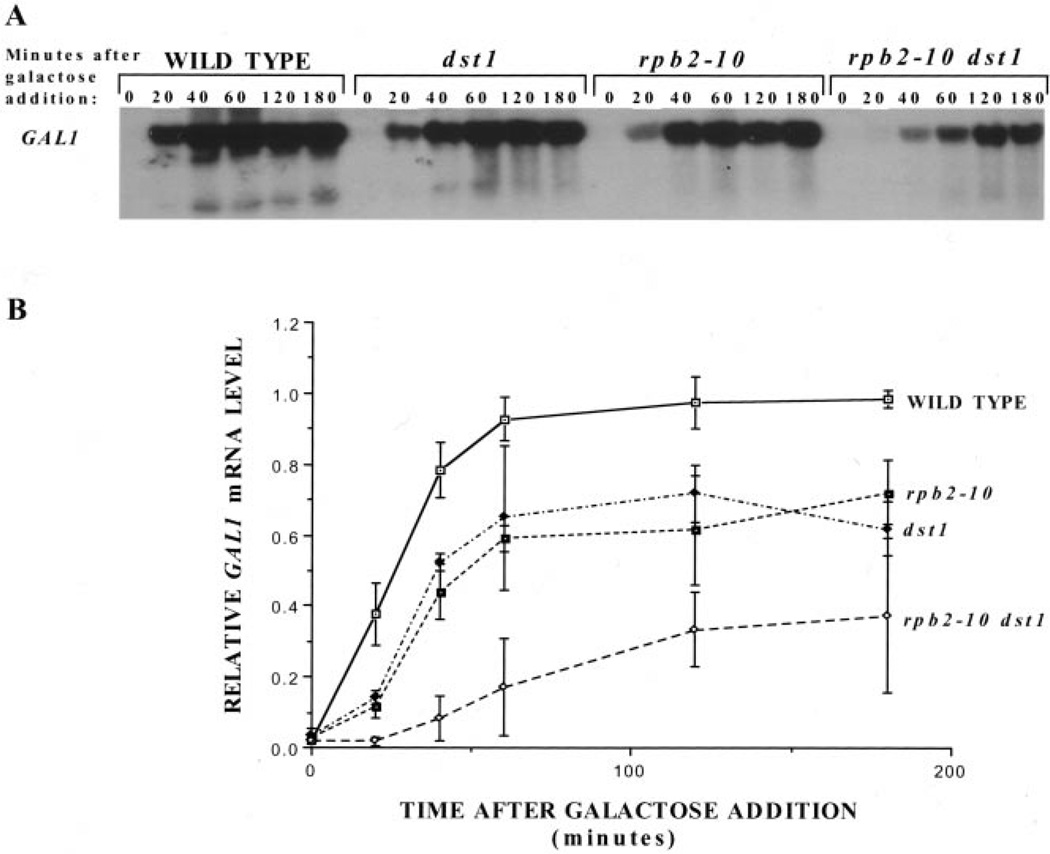
Fig. 2. Galactose induction of GAL1 in wild-type and mutant yeast strains.
A, Northern analysis was carried out on RNA from DY103 (WILD TYPE), DY106 (dst1), DY105 (rpb2–10), and DY108 (rpb2–10 dst1) cells at various times following galactose addition. Blots were probed for GAL1 mRNA, and results from three separate experiments were quantitated using a PhosphorImager. GAL1 transcript levels were corrected for background levels of the same area for each sample lane. These values were divided by the maximal level of GAL1 transcript present in wild-type cells at 120 min, and the means and standard deviations (error bars) were plotted (B).

