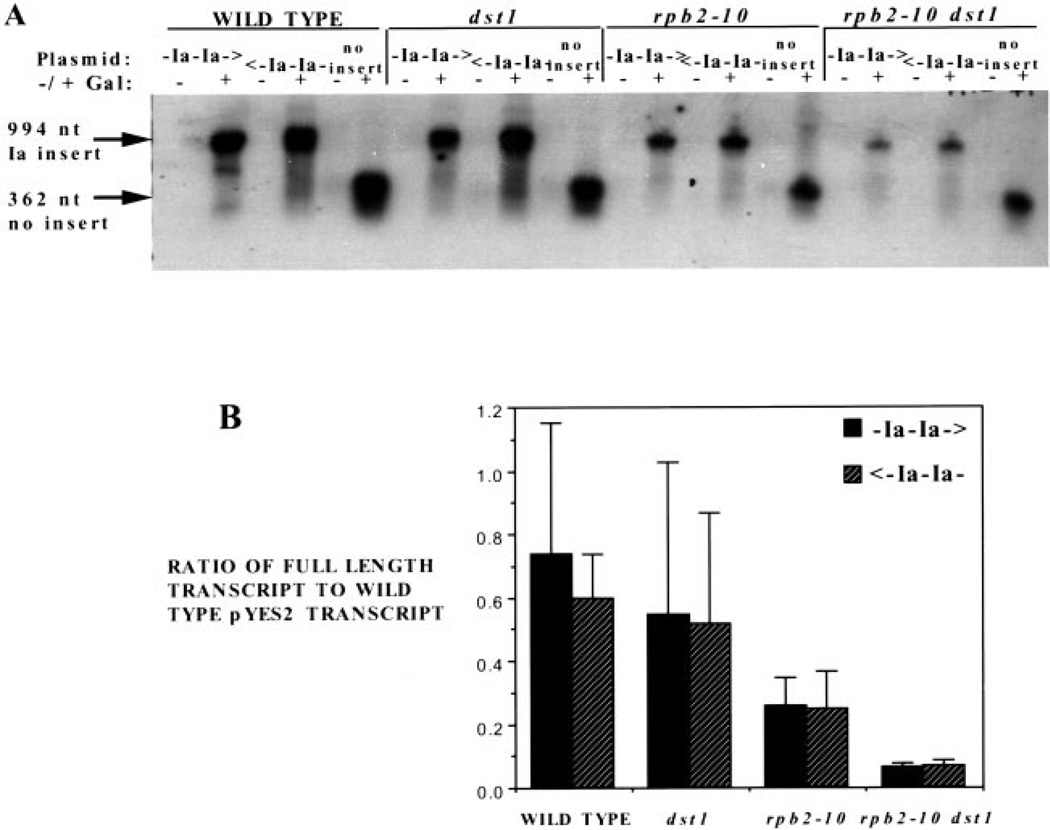
Fig. 7. Transcription of the Ia arrest site in wild-type and mutant yeast.
A, Northern blot analysis was carried out on RNA prepared from DY500, DY510, DY520 (WILD TYPE); DY501, DY511, DY521 (dst1); DY502, DY512, DY522 (rpb2–10); and DY503, DY513, DY523 (rpb2–10 dst1) yeast after 60 min of galactose (+) or no (−) induction. The blot was probed with the PCR product 3′ of the Ia site, shown in Fig. 6. Arrows indicate the full-length transcripts produced from the different plasmids. B, the mean (n = 3) transcript level for galactose-induced cultures was determined by PhosphorImager, corrected for background levels, and normalized to transcript levels in wild-type cells containing pYES2. The means and standard deviations (error bars) were plotted.

