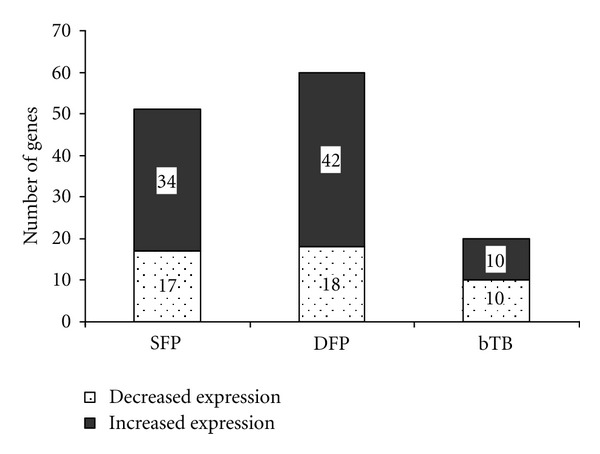
Figure 1.

Number of genes from microarray analysis that were differentially expressed (P ≤ 0.01) within single antemortem test-false positive (SFP), double antemortem test-false positive (DFP), and bTB-infected (bTB) groups of cattle. The RNA used for microarray analysis was harvested after a 4-hour stimulation of whole blood with tuberculin, and comparison of gene expression levels was with a reference pool of mRNA harvested from the blood of healthy cattle after 4-hour stimulation with tuberculin. The number of genes for each group of cattle that showed increased expression (solid box) or decreased expression (shaded box) relative to the reference pool of RNA is indicated by the figure in the boxes.
