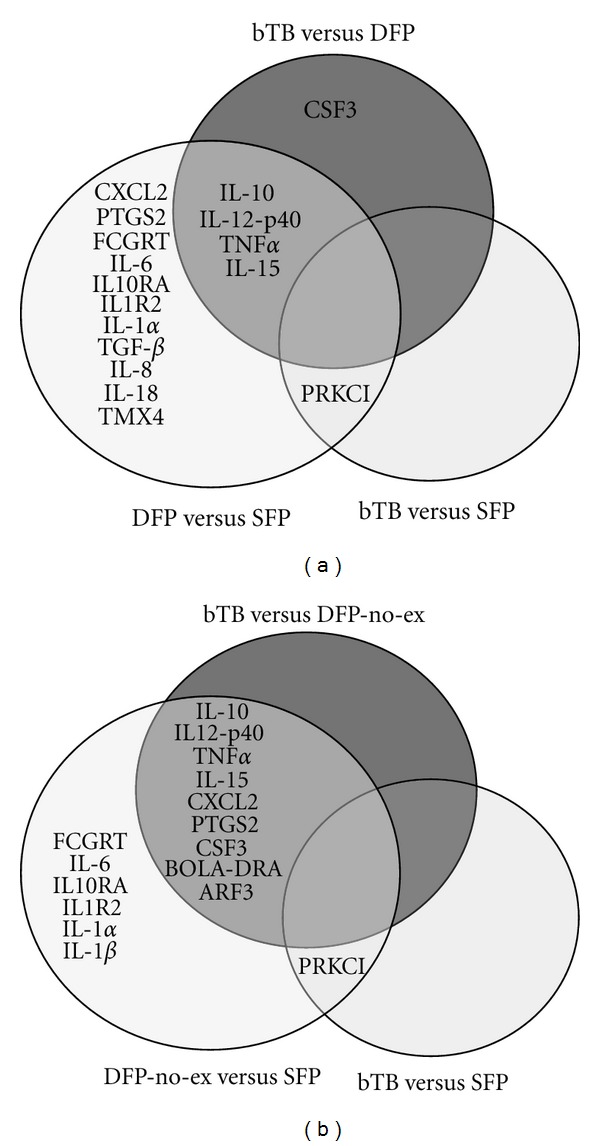
Figure 4.

Venn diagrams showing the statistically significant (adj P ≤ 0.05) differentially expressed genes that were unique to or common among (a) single antemortem test-false positive (SFP), double antemortem test-false positive (DFP), and bTB-infected (bTB) groups of cattle in initial analysis of 30 cattle and (b) single antemortem test-false positive (SFP), double antemortem test-false positive non-bTB-exposed (DFP-non-ex), and bTB-infected (bTB) groups of cattle after removal of bTB-exposed cattle from the DFP group. The gene expression levels were determined by qPCR assay, where each animal was calibrated relative to the reference pool of RNA from healthy cattle; differential expression between 2 groups of cattle (i.e., X versus Y) was determined using ANOVA analysis.
