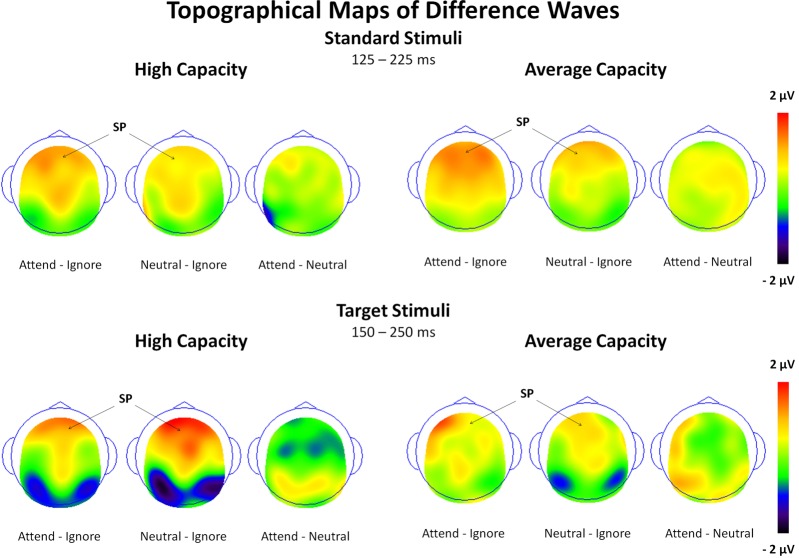
Figure 5.
Surface potential maps of difference waves under Attend—Ignore, Neutral—Ignore, and Attend—Neutral conditions for the SP interval for high capacity and average capacity subjects in response to standard stimuli and target stimuli. Arrows illustrate the presence of the Selection Positivity (SP).

