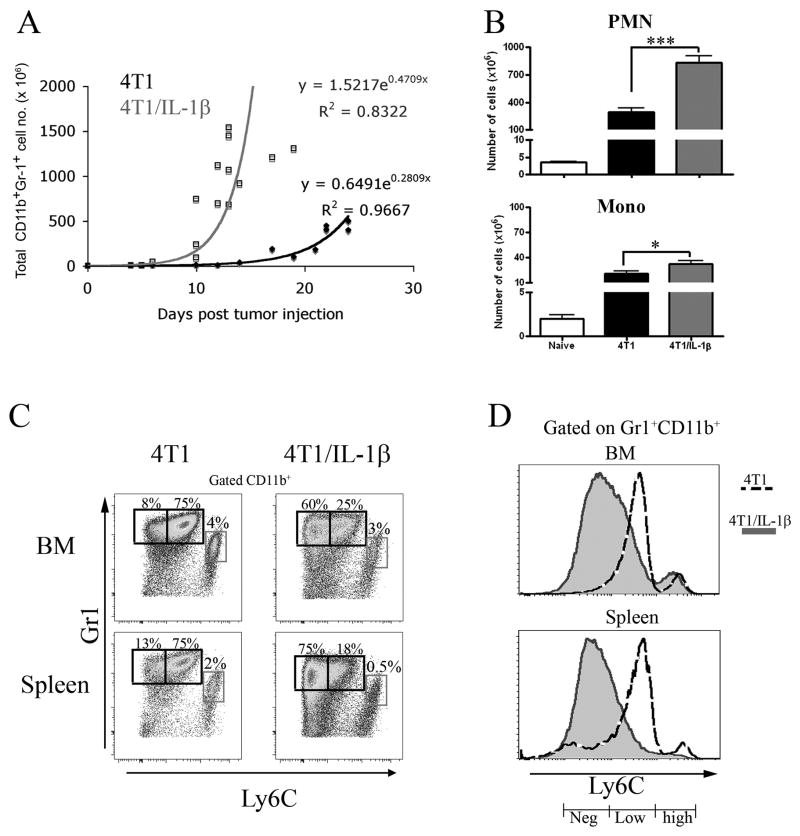
Figure 1. 4T1/IL-1β tumors enhance the accumulation of splenic Ly6Cneg MDSC.
A) 2 × 10⁵ 4T1 and 4T1/IL-1β tumor cells, respectively, were injected into the right footpad of BALB/c mice. Spleen cells from tumor-bearing mice (n=12–16) were counted and single cell suspensions were stained for FACS analysis. Total Gr-1+CD11b+ (black line - 4T1, grey line -4T1/IL-1β) cell numbers were calculated at the indicated days after tumor cell injection. Regression curves were calculated using MS Excel. CD11b+Gr-1+ cells were identified as indicated in Supplemental Figure 1. (B–D) Splenocytes from tumor-bearing BALB/c mice (tumor diameter: 10–12 mm) were stained for Gr-1, CD11b, Ly6C. (B) Total numbers of PMN-MDSC and Mono-MDSC present in the different tumor-bearing mice. (C) Gr-1 versus Ly6C expression on gated CD11b+ cells. CD11b+ cells were identified as indicated in Supplemental Figure 2A. (D) Histograms of Ly6C expression by Gr-1+CD11b+ cells from the indicated tumor bearing mice. (Shaded–4T1, dotted line - 4T1/IL-1β). The results show mean values pooled from 3–5 independent experiments (n=3–5 for each experiment). Error bars show SD. **p<0.01, *p<0.05, calculated using the two-sided Student’s t-test.

