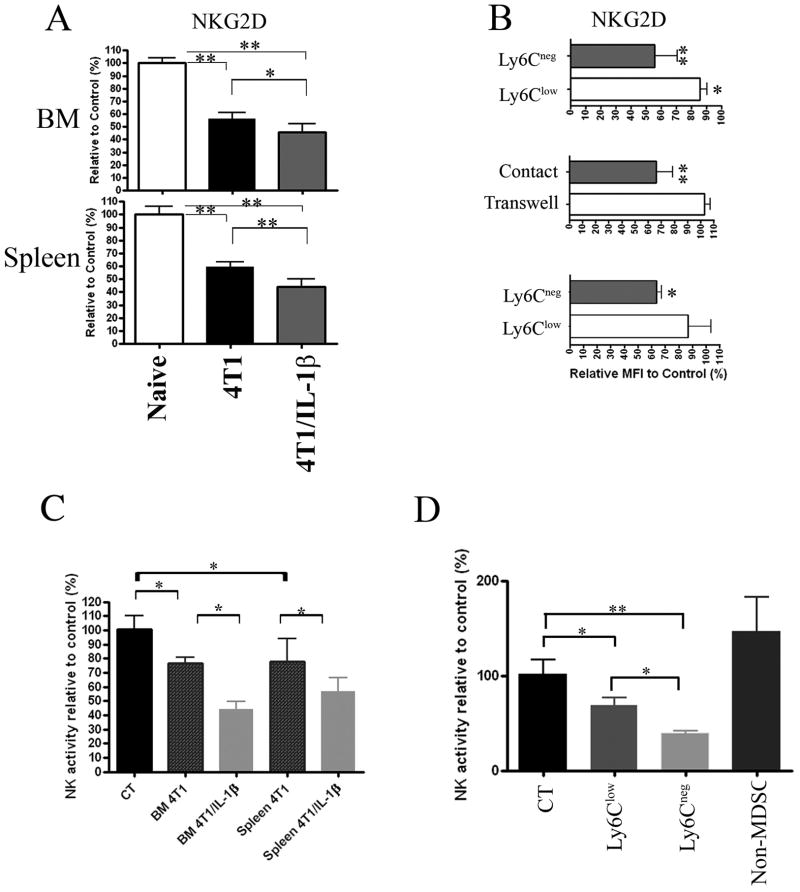
Figure 5. MDSC from tumor-bearing mice affect NKG2D expression by NK cells.
NK cells were identified as indicated in Supplemental Figure 4. (A) Mean fluorescence intensity of NKG2D expression by BM (top) and splenic (bottom) CD122+NKp46+ NK cells from Rag2−/−mice bearing 4T1 and 4T1/IL-1β tumors (n=6–8), respectively. Results are shown relative to NK cells from naïve Rag2−/− (controls were set to 100%). One representative result from 3 independent experiments is shown. (B) NKG2D expression by CD122+NKP46+DX5+ cells among Rag2−/− splenocytes after 24h-co-culture with enriched Ly6Clow and Ly6Cneg MDSC (top), or after 24h-co-culture of naïve Rag2−/− splenocytes with enriched Ly6Cneg MDSC in transwell plates (middle). NKG2D expression by splenic NK cells (CD122+DX5+NKP46+) 3 days after adoptive transfer of enriched Ly6Cneg and Ly6Clow MDSC, respectively, into naïve Rag2−/− mice (bottom). Results from one representative experiment of three performed. (C) Activity of host NK cells measured in vivo after i.v. injection of 2x10⁶ MACS-enriched Gr-1+CD11b+ cells from BM or spleen of mice bearing 4T1 and 4T1/IL-1β tumors as indicated. Activity is given relative to NK cells from non-injected control mice (n=4–5). Results from one representative experiment of two performed. (D) Ly6Clow MDSC, Ly6Cneg MDSC and non-MDSC were sorted from spleens of 4T1/IL-1β tumor-bearing mice and 5x10⁵ cells of each population were injected i.v. into separate naïve BALB/c mice (n=5) and NK cell activity was measured in vivo. Results from one representative experiment of two performed. Error bars show SD. **p<0.01, *p<0.05 using two-sided Student’s t-test.

