
Figure 6.
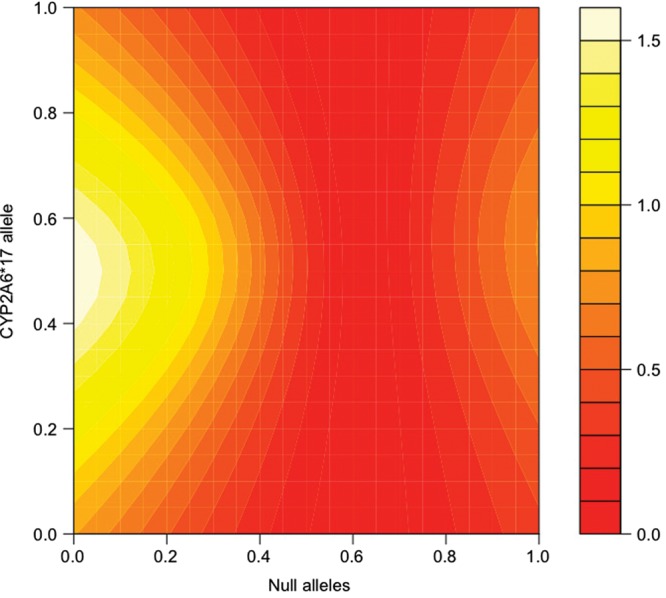
CYP2A6*17 and null alleles, modeling the association with the estimated metric in dependent African Americans. The fit of the association between CPD and the predicted metabolism metric determined by the model, scanning allele parameters used to calculate the prediction between zero activity (0.0) and maximum activity (1.0). Essentially, the map demonstrates a variety of possible models, with differing relationships between their allele parameters, and the relative ability of each model to predict a metabolism metric that is significantly correlated with CPD. Points along the diagonal from lower left to upper right correspond to models where the two scanned parameters are equal. Assumed null alleles are CYP2A6*2, *4 and *12. The color key refers to the –log10 of the P-value for the association between the metabolism metric and CPD in dependent African Americans. Coordinates color coded as >1.3 (dark yellow) represent significant associations (P < 0.05).