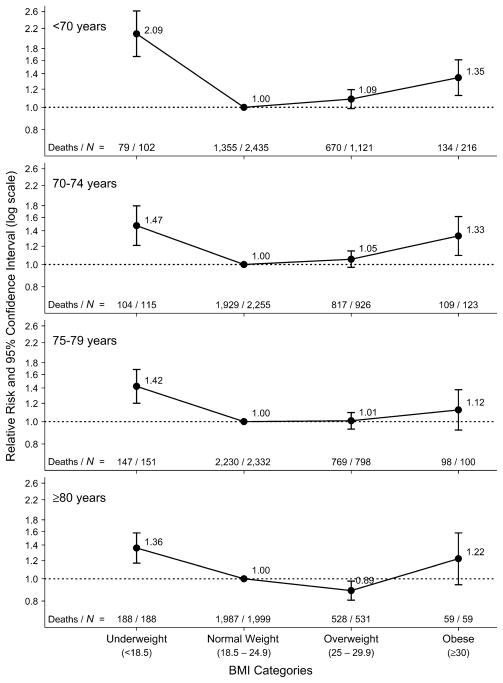
FIGURE 2.
Relative risk of all-cause mortality according to body mass index (BMI; weight (kg)/height (m)2) category at study entry for different age groups at entry, Leisure World Cohort Study, 1981–2004. Results were adjusted for gender and smoking status. The normal weight category within each age group was used as the reference category. Bars, 95% confidence interval.

