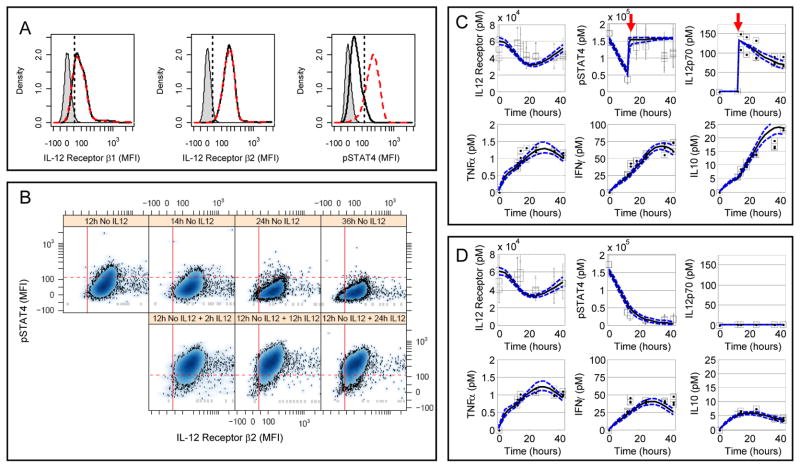
Fig. 2.
Observed 2D6 response to IL-12 as a context for defining and calibrating the cue-signal-response model. (A) Changes in IL-12Rβ1 (left sub-panel), IL-12Rβ2 (center sub-panel), and phosphorylated STAT4 (right sub-panel) were used to quantify intracellular changes in response to IL-12 stimulation in 2D6 cells. The results from three 2D6 cell populations are shown: unstained cells (gray shaded), cells cultured without IL-12 for 14 hours (black solid line), and cells cultured without IL-12 for 12 hours followed by 2 hours with IL-12 (red dashed line). The straight lines indicate the data-driven threshold for the upper limit of protein expression or activity for 95% of the unstained (IL-12Rβ1 and IL-12Rβ2) or unstimulated (pSTAT4) 2D6 cells. (B) Scatter plots for phosphorylated STAT4 (y-axis) versus IL-12Rβ2 (x-axis). Each sub-panel corresponds to a different time following IL-12 stimulation. (C + D) 2D6 cells exhibited dynamic changes in response to culture conditions and IL-12 stimulation (Panel C - high density + IL-12; Panel D - high density without IL-12). The changes in cellular IL-12Rβ2 and pSTAT4 and IL-12p70, TNFα, IFNγ, and IL-10 in 2D6-conditioned media were represented by median values (squares) and compared against posterior predictions for the calibrated cue-signal-response model (lines). Error bars for IL-12Rβ2 and pSTAT4 enclose 67% of the population. Red arrows indicate the addition of IL-12p70. Results representative of three technical replicates obtained for each of two biological replicates.

