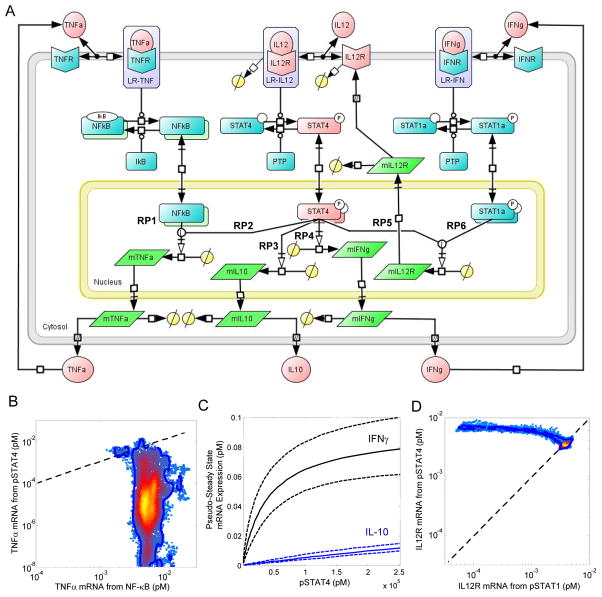
Fig. 3.
The cue-signal-response model developed to describe the cellular response to IL-12 in 2D6 cells. (A) A schematic diagram of the model includes IFN-γ, IL-12p70, and TNF-α as biochemical cues; intracellular signaling events associated with the canonical IL-12, IFN-γ, and TNF-α signaling pathways; regulation of the IL-12 receptor, and the synthesis of IFN-γ, IL-10, and TNF-α as the cellular response to IL-12. Elements of the model that were calibrated to experimental measurements are highlighted in red. Specific branches within the signaling network that regulate gene expression are annotated with the labels RP1 through RP6. Posterior distributions in the simulated pathway flux associated with NF-κB (RP1) versus STAT4 (RP2) regulation of TNFα mRNA expression (panel B), simulated IL-10 (RP3 - blue lines) and IFN-γ (RP4 - black lines) mRNA expression as a function of STAT4 activation (panel C), and the simulated pathway flux associated with STAT4 (RP5) versus STAT1 (RP6) regulation of IL12Rβ2 mRNA (panel B). Systems Biology Graphical Notation was used to represent the biochemical events encoded within the cue-signal-response model.

