Fig. 5.
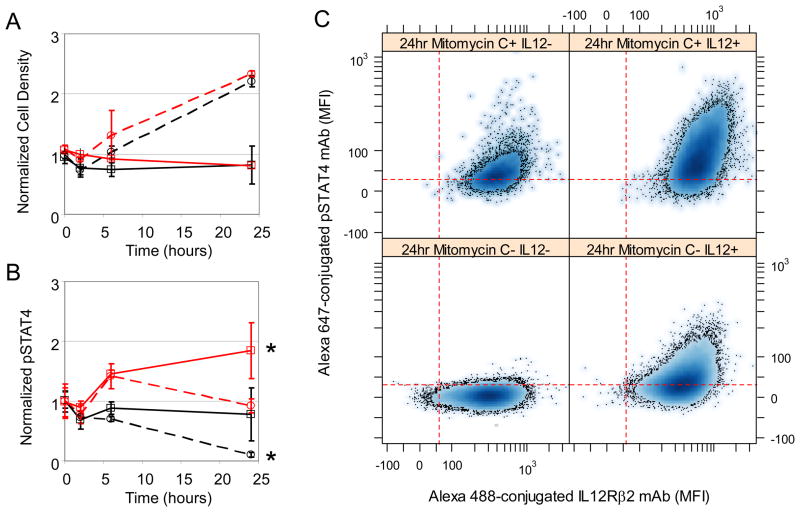
Dilution due to cell proliferation influences the decline in STAT4 phosphorylation. Dynamic changes in cell density (Panel A) and phosphorylated STAT4 (Panel B) in 2D6 cells (solid lines) were compared against 2D6 cells cultured with Mitomycin C (dotted lines). IL-12-stimulated cells (red) were also compared against cells cultured in cRPMI alone (black). Representative flow cytometry assays of pSTAT4 versus IL12Rβ2 expression at the 24 hr time point are shown in Panel C. Results reported as mean response (± standard deviation) and are representative of at least three technical replicates and two biological replicates. A finding of statistical significance (p<0.05) is indicated by *.

