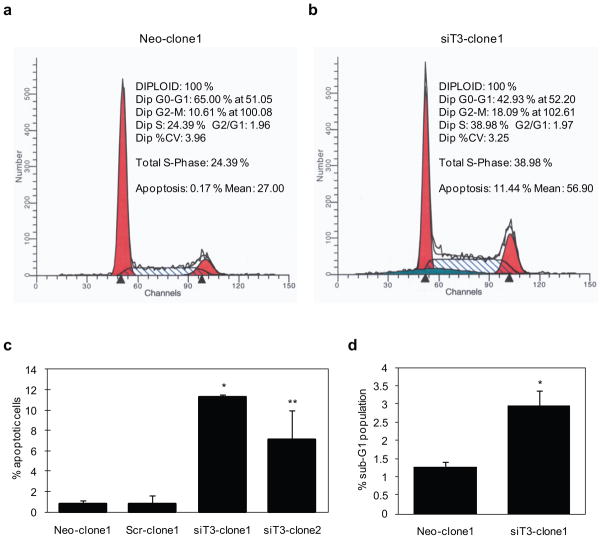
Figure 4. Flow cytometric analysis of cell cycle distribution and apoptosis in stable control and GalNAc-T3 RNAi S2-013 cells.
(a and b) Cells were grown to approximately 70% confluence and removed from the culture surfaces by trypsinization, and DNA content and apoptosis were determined. Raw data were modeled using ModFit cell cycle analysis software. The profiles are representative histograms of triplicate assays. a, control; b, GalNAc-T3 RNAi cells.
(c) The percentage of apoptotic cells is shown between control and GalNAc-T3 RNAi S2-013 cells. Experiments were repeated three times; *p < 0.001, **p < 0.005 compared with control cells.
(d) The percentage of cells in the sub-G1 population was determined from at least 10,000 ungated cells between the control and GalNAc-T3 RNAi S2-013 cells. Experiments were repeated three times; *p < 0.05 compared with control cells.

