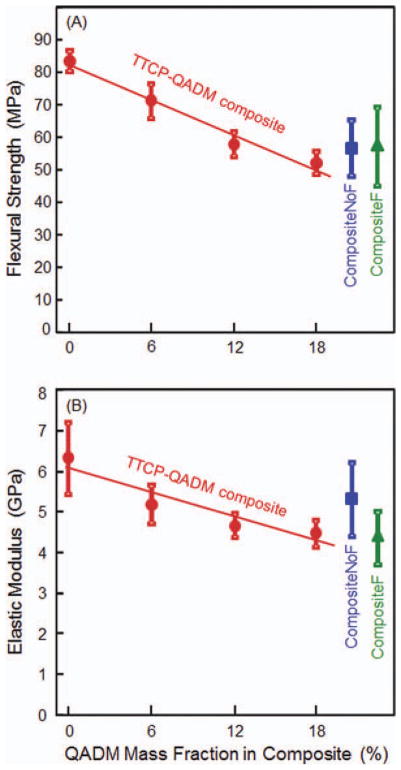
FIGURE 1.
Composite mechanical properties: (A) flexural strength and (B) elastic modulus. The photo-activated TTCP-QADM composite was filled with 40% TTCP and 30% glass particles by mass. The resin matrix was BisGMA-TEDGMA-QADM. Flexural strength and elastic modulus for the two commercial control composites are included near the right axis. Each value is the mean of six measurements, with the error bar showing one standard deviation (mean ± SD; n = 6). The linear correlation coefficient R2 = 0.974 for strength and R2 = 0.884 for elastic modulus. [Color figure can be viewed in the online issue, which is available at wileyonlinelibrary.com.]

