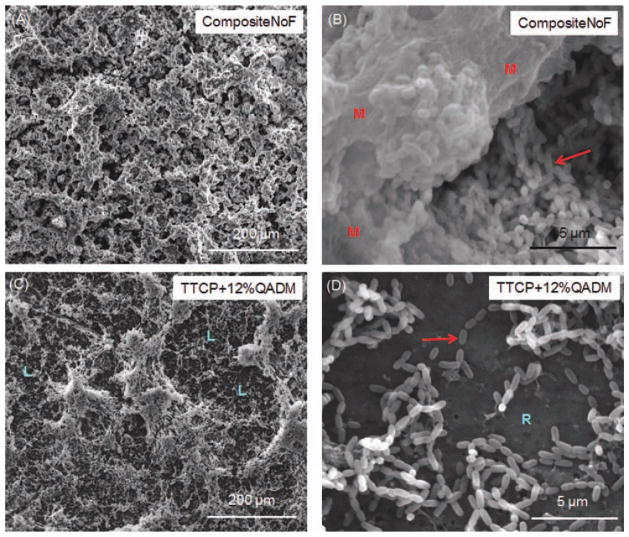
FIGURE 3.
SEM images of biofilms on composites at 3 days. (A) CompositeNoF control at a low magnification. (B) CompositeNoF at a higher magnification. (C) TTCP+12%QADM at a low magnification. (D) TTCP+12%QADM at a higher magnification. CompositeNoF had thick and homogeneous biofilm coverage. TTCP+12%QADM had thinner biofilms and patchy coverage. Arrow in (B) indicates the bacteria cells, and “M” indicates the biofilm matrix. “L” in (C) indicates areas of less biofilm coverage. Arrow in (D) indicates individual cells. “R” indicates the resin composite not covered with biofilm. CompositeF and TTCP+0%QADM were similar to CompositeNoF and not included here. TTCP+18%QADM had slightly less biofilm coverage, while TTCP+6%QADM had slightly more biofilm coverage, than TTCP+12%QADM shown in (C) and (D). [Color figure can be viewed in the online issue, which is available at wileyonlinelibrary.com.]

