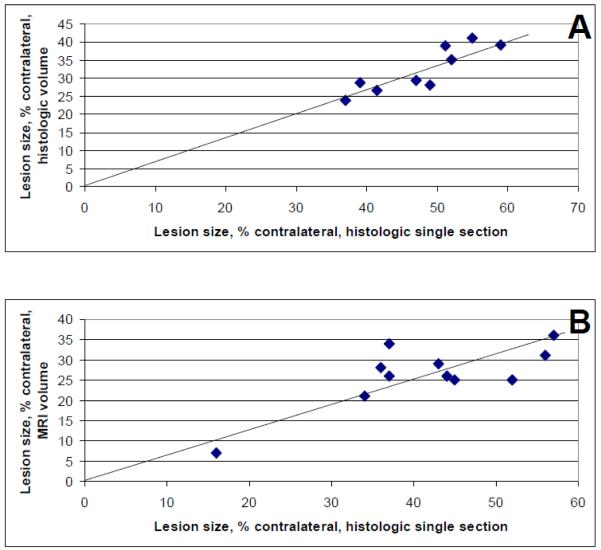
Figure 1.
Lesion size correlations. (A) Lesion size expressed as % contralateral volume was obtained in eight histologic sections spanning bregma 3.24 to -6.24 (Osborne et al., 1987) and correlated with lesion size expressed as % contralateral area in a histologic section at bregma 1.1. The correlation coefficient was 0.9, p=0.002, n=9. (B) Lesion size expressed as % contralateral volume was obtained using magnetic resonance imaging (MRI) and correlated with lesion size expressed as % contralateral area in a histologic section at bregma 1.1. The correlation coefficient was 0.8, p=0.005, n=11.

