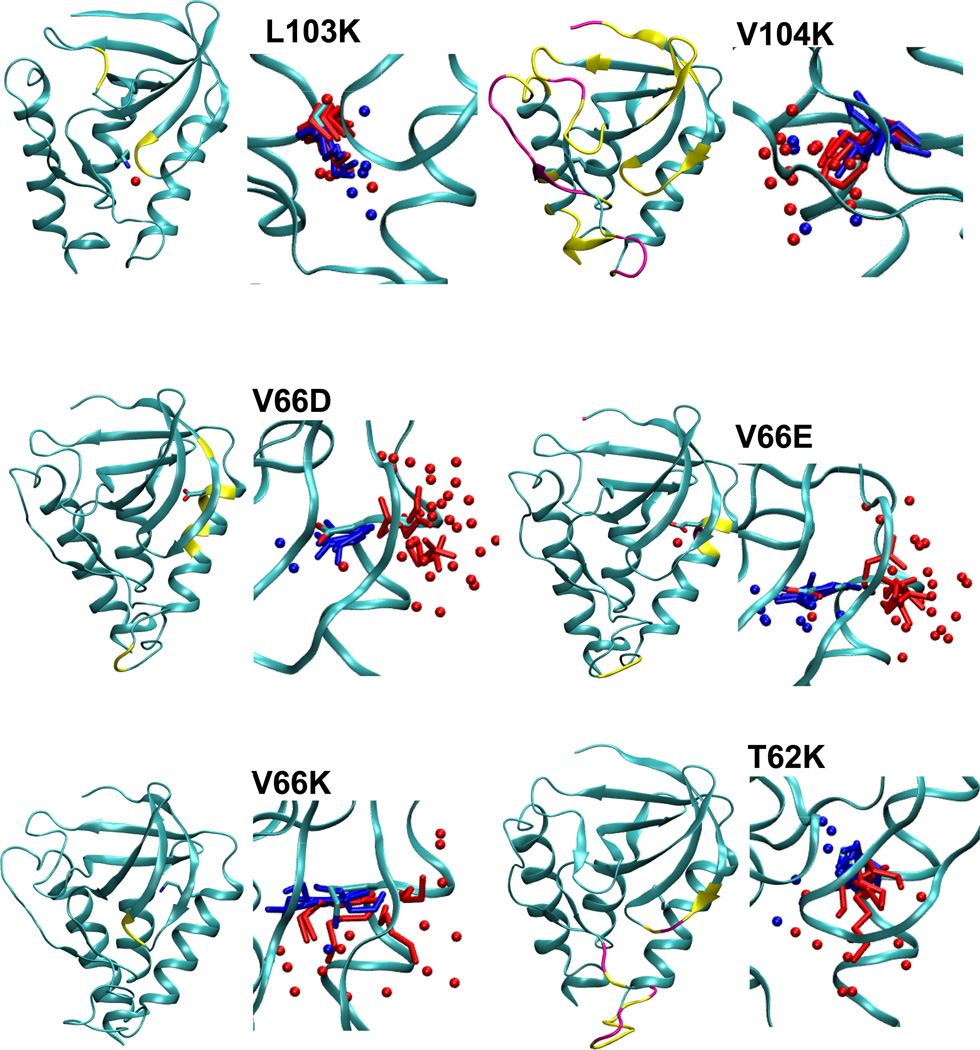
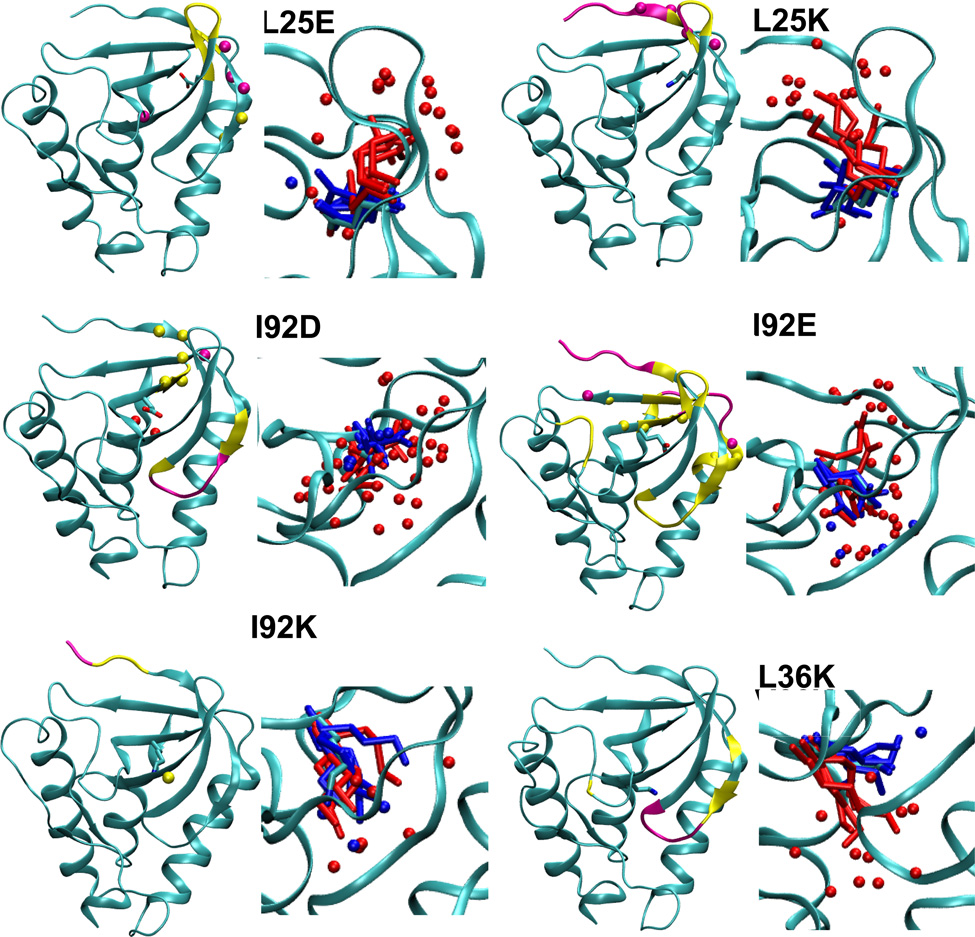
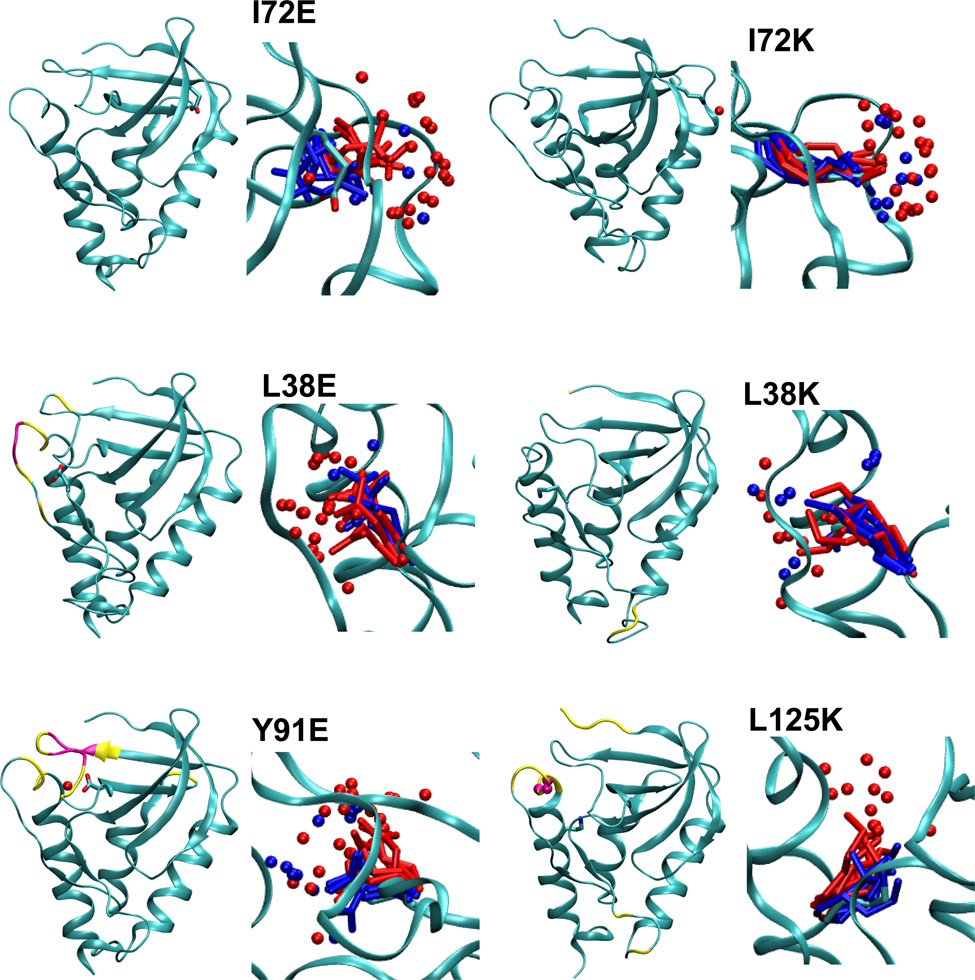
Figure 3.
Summary of structural consequences of ionization of internal groups in 18 variants of SNase. For each variant: (LEFT) Difference in backbone RMSD values between the simulations with internal ionizable groups in the charged and in the neutral states. Yellow and magenta identify residues that display a difference larger than 1 and 2 Å, respectively. Yellow and magental spheres identify residues that are unfolded in simulations with the internal ionizable group in the charged state in more than 25% and 50% of simulations, respectively. (RIGHT) Snapshot from the last ns of simulations showing the conformation and state of hydration of the internal ionizable side chains in the charged (red) and the neutral (blue) state. Spheres identify water molecules near the ionizable moiety. Figure made with VMD.57


