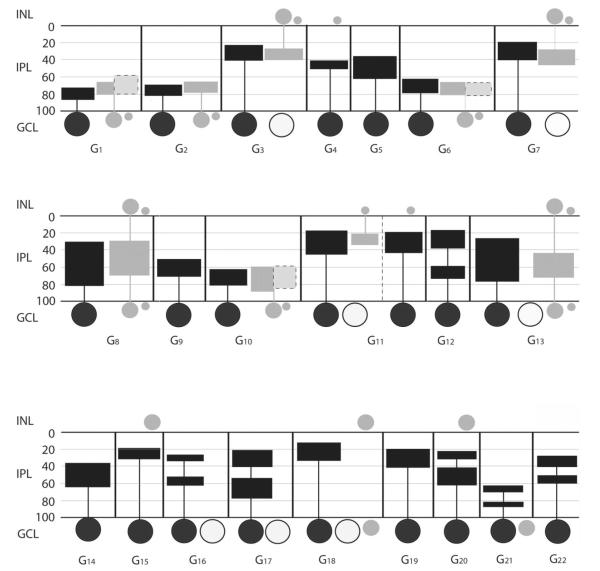
Figure 14.
Schematic summarizing the tracer coupling patterns of the 22 ganglion cell subtypes in the mouse retina. In addition to coupling, some morphological features of both injected and coupled cells are also shown, including dendritic and axonal (if any) stratification levels in the IPL, localization and relative soma sizes of both ganglion and amacrine cell somata. Black horizontal lines represent the scleral and vitreal borders of the IPL, whereas gray horizontal lines separate the five IPL strata. Numbers on the left represent percent depth levels in the IPL. Summary diagrams of ganglion cells are separated with vertical black lines for clear distinction between cell subtypes. Large filled circles represent the injected ganglion cell bodies in each box, whereas large open circles symbolize somata of tracer-coupled ganglion cells (if any). Gray filled circles represent somata of tracer-coupled amacrine cells. Sizes of gray spots reflect relative size differences among coupled amacrine cell somata. Filled rectangles connected to somata represent the maximum extent of dendritic arbors for injected ganglion cells (black), for amacrine cell dendrites (gray) and for amacrine cell axons (light gray with dashed frame). Note that the widths of rectangles do not reflect the diameter of the dendritic fields.

