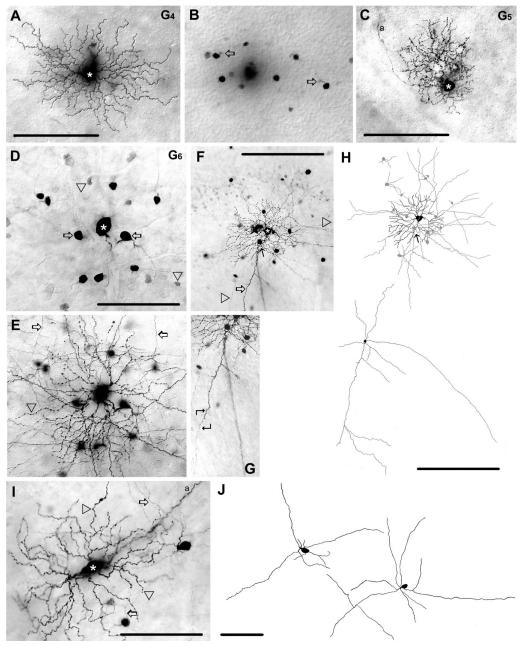
Figure 4.
Morphology and tracer coupling pattern of the G4,G5, and G6 ganglion cells. A: Photomicrograph showing a G4 ganglion cell (asterisk) with medium-sized dendritic arbor. B: Same frame as in panel A, but with focal depth at the level of the proximal INL. The G4 cell is tracer coupled to amacrine cells with somata that lay in the INL; primary dendrites are indicated by open arrows. C: Photomicrograph showing a tracer-injected G5 ganglion cell (asterisk). This G5 cell displays a dense, bushy dendritic arbor, but shows no evidence of tracer coupling. D: Photomicrograph showing a Neurobiotin-injected G6 ganglion cell (asterisk). This cell displays heterologous coupling to small (arrowheads) and large (arrows) amacrine cell somata displaced to the GCL. E: Photomicrograph shows the same frame as in D, but with focus on the dendritic processes (arrowhead) of the injected G6 cell. Arrows point to amacrine cell processes costratifying with dendrites of the injected G6 cell. F: Photomicrograph of another G6 cell (asterisk) showing that coupled amacrine cells display both thick dendritic (arrow) and thin axonal (arrowheads) processes. Filled arrow (here and in panel H top) points to the amacrine cell whose dendrite is magnified in panel G and drawn in panel H bottom. G: A selected area of panel F is magnified to show the proximal soma/dendritic region of a coupled amacrine cell (filled arrows in panels F and H top). Angled arrows frame the area where a characteristic dendrite/axon transition occurs. H: Top panel shows a camera-lucida drawing of the G6 ganglion cell (black) shown in panel F as well as somata and processes of coupled amacrine cells (gray). Lower panel shows the proximal dendritic/ axonal arbor of the coupled amacrine cell marked in panels F,H top (arrow). Note that due to a limited tracer flow into coupled cells this drawing shows only a portion of their arbor. I: AG6 ganglion cell whose soma is elongated, but otherwise shares all other features of G6 cells. Arrowheads label injected ganglion cell dendrites, whereas arrows point to dendritic processes of coupled amacrine cells. J: Camera-lucida drawings display cell bodies and proximal dendritic/axonal areas of amacrine cells coupled to elongated G6 ganglion cells. Soma/ dendritic morphology of these amacrine cells are identical to amacrine cells coupled to other G6 ganglion cells (see panels D–H). Note that due to a limited tracer flow into coupled cells this drawing shows only a portion of their arbor. a, axonal process. Scale bars = 100 μmin A–E,I–J; 200 μm in F,H; 150 μminG.

