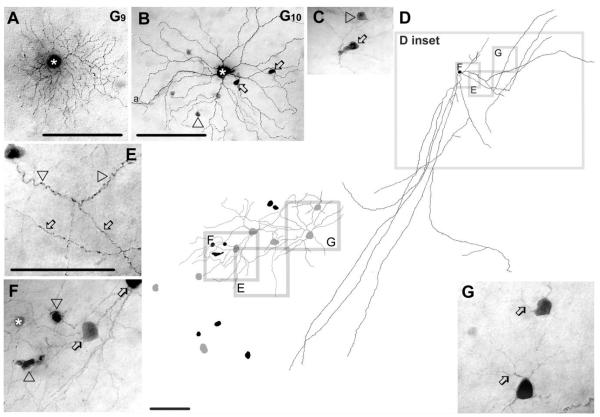
Figure 6.
Morphology and tracer coupling pattern of the G9 and G10 ganglion cells. A: Photomicrograph of a G9 cell (asterisk) with relatively dense branching and medium-sized dendritic arbor. This G9 cell shows no evidence of tracer coupling. B: AG10 cell (asterisk) that is coupled to amacrine cells with somata displaced into the GCL. Somata of these coupled amacrine cells were either round (arrowhead) or elongated (arrows). C: High-magnification image shows cell bodies of two amacrine cells coupled to G10 cells, which display elongated (arrow) and spherical (arrowhead) cell bodies. D: Camera-lucida drawing shows the entire dendritic/axonal arbor of a Neurobiotin-injected polyaxonal amacrine cell whose soma/dendritic morphology resemble the amacrine cells coupled to G10 ganglion cells (right); D inset specifies areas that are enlarged (left). This latter drawing shows cell bodies of coupled amacrine (black) and ganglion cells (gray). Frames E–G in both D right and D left mark areas enlarged in corresponding E–G photomicrographs. E: This image shows wavy dendritic (arrowheads) and beaded axonal (arrows) processes of the injected polyaxonal amacrine cell. F: Enlarged image showing the injected amacrine cell soma (asterisk), spherical and elongated coupled amacrine cell somata (arrowheads) and heterologously coupled ganglion cell somata (arrows). Coupled amacrine cell somata are similar to those amacrine cells that are coupled to injected G10 cells, whereas the coupled ganglion cells resemble G10 cells shown in panels B and C. G: Two coupled ganglion cells showing relatively long bifurcating primary dendrites (arrows) characteristic of G10 cells. a, axon. Scale bars = 100 μm in A,B,D right, E–G; 30 μminC;140 μm in D left.

