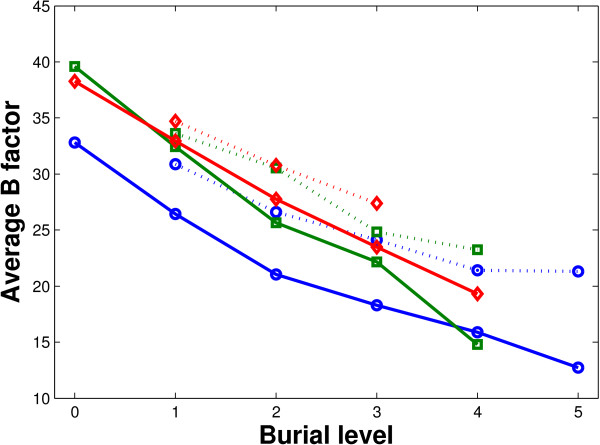
Figure 11.
Relation between burial level and B factor. Relation between burial level and B factor. The figure shows the average of B factor of water molecules (dotted lines) and non-water interfacial atoms (solid lines) in our data set in obligate (blue, circle marker), non-obligate (green, square marker) and crystal packing (red, diamond marker) protein-water-protein interfaces at different burial levels. The B factors are averaged within the atoms in each interface first and them averaged among the interfaces.

