
Figure 8.
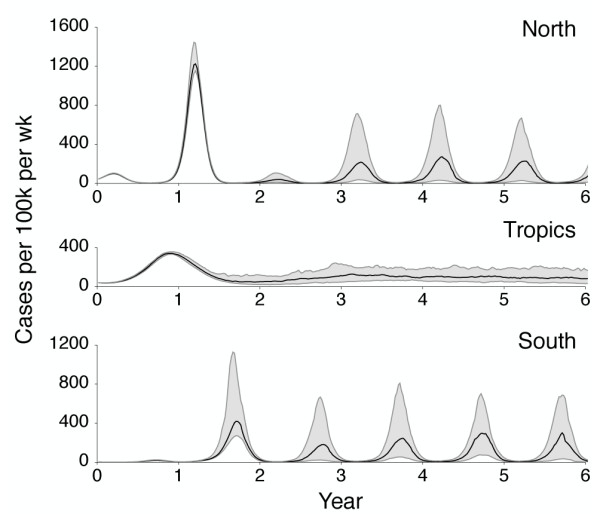
Time series of incidence across 100 replicate simulations with identical initial conditions. Panels show incidence in the north, tropics, and south regions over the course of 6 years. Solid black lines represent the median weekly incidence across the 100 replicate simulations, while gray intervals represent the interquartile range across simulations. There is little variability for the first year of replicate simulations. Replicate simulations were initialized with the end state of the 40-year simulation shown in Figure 2.