Figure 2.
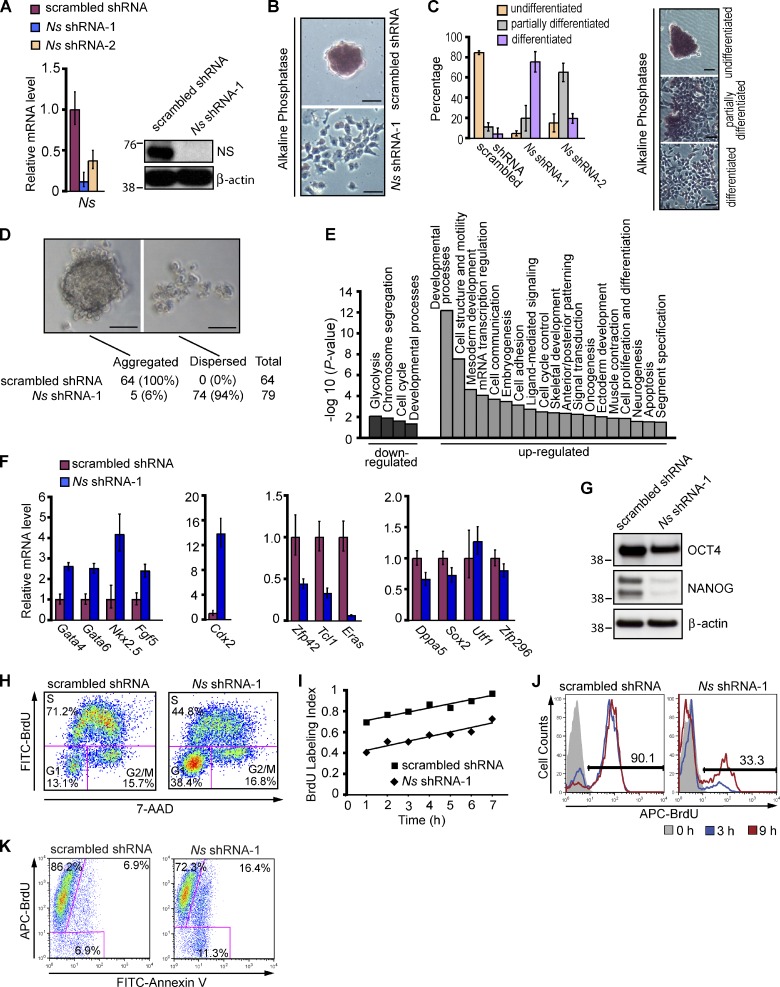
Nucleostemin is essential for maintaining the self-renewal of ESCs. (A) Depletion of NS in ESCs. For A–K, the E14 line of mouse ESCs was transfected with vectors expressing the puromycin resistance gene and either an shRNA targeting Ns or scrambled shRNA. Puromycin selection was initiated 24 h after transfection and continued for 3 d before cells were harvested for subsequent analysis. Untransfected cells were eliminated by 2 d of drug selection. Left, QPCR analysis of Ns mRNA level. Right, Western analysis of NS protein with β-actin as a loading control. The RNA data in A and F were normalized to the expression of Gapdh and are represented as mean ± SEM with n = 3. The data are displayed relative to results with scrambled shRNA transfected controls. The positions of molecular mass standards (in kilodaltons) are shown in A and G. (B) Representative images showing differentiation of ESCs upon NS KD. 4 d after the indicated transfections, NS KD cells became flattened and lost the stereotypical colony morphology and AP staining. Under the same culture conditions, a normal undifferentiated phenotype with distinct colonies strongly expressing AP was maintained in controls with scrambled shRNA. (C) Quantification of undifferentiated, partially differentiated, and fully differentiated ESC colonies 5 d after the indicated transfections. The data in the left panel represent the results of two independent experiments with error bars indicating standard deviations. Approximately 100 colonies were counted for each transfection. The right panel illustrates representative morphology of the three types of colonies used to score the extent of differentiation, as described in Materials and methods. The KD of NS by shRNA-2 was less efficient than that by shRNA-1 (see Fig. S2, C and D for more information). (D) Failure of NS KD cells to form embryoid bodies. 3 d after transfection with shRNAs, ESCs were placed in hanging drops and examined 24–72 h later. The percentage values represent the fraction of hanging drops that formed EBs or remained dispersed after 24 h of culture. (E) Categories of genes whose expression changed in response to KD of NS by Ns shRNA-1 in ESCs. Data were obtained from whole-genome expression analysis of four biological replicates of NS KD cells and scrambled shRNA transfected controls. See Materials and methods and Table 1 for details. (F) QPCR analysis of RNAs specific for endoderm (Gata4 and Gata6), mesoderm (Nkx2.5), ectoderm (Fgf5), TE (Cdx2), and ESCs (Zfp42, Tcl1, Eras, Dppa5, Sox2, Utf1, and Zfp296) in NS KD cells and controls. Analysis by QPCR was performed 4 d after the indicated transfections. (G) Western analysis of ESC markers OCT4 and NANOG 4 d after NS KD in ESCs, with β-actin as a loading control. (H) Cell cycle profiles of asynchronously growing ESCs 4 d after transfection with shRNAs. Cells were pulsed with BrdU for 20 min, then fixed and stained with anti-BrdU antibodies and 7-AAD followed by FACS analysis. The percentages of cells in the various phases of the cell cycle are shown. (I) Cumulative BrdU labeling curves. 4 d after the indicated transfections, cells were fed with fresh media containing BrdU every 2 h, and the BrdU labeling index was determined by FACS at the indicated time points. The time necessary to reach the maximum labeling index corresponds to the total cell cycle length minus the length of the S phase (TG2+M+G1; Nowakowski et al., 1989) and was extrapolated by linear regression analysis. One of three independent experiments with comparable results is shown. (J) Cell cycle reentry analysis. Cells with the indicated transfections were synchronized at the G2/M transition at 4 d after transfection with shRNAs, then released to enter S phase, as described in Materials and methods. At subsequent time points, cells were pulsed with BrdU for 20 min and subjected to FACS analysis to measure entry into S phase. Analyses were performed at the time of release from the cell cycle block and 3 h and 9 h afterward. Frequencies indicate percentages of BrdU-positive cells at 9 h after release. (K) DNA replication and apoptosis. 4 d after transfection of ESCs with shRNAs, cells were incubated with BrdU for 22 h, then fixed and stained with anti-BrdU antibodies and Annexin V for subsequent FACS analysis. In total, 93.1% (86.2% + 6.9%) of control transfectants and 88.7% (72.3% + 16.4%) of NS KD cells were positive for BrdU incorporation. Cells that have cycled through the S phase and have become apoptotic during the BrdU labeling period are positive for both BrdU incorporation and Annexin V (6.9% of controls vs. 16.4% of NS KD cells). Bars, 50 µm.

