Figure 6.
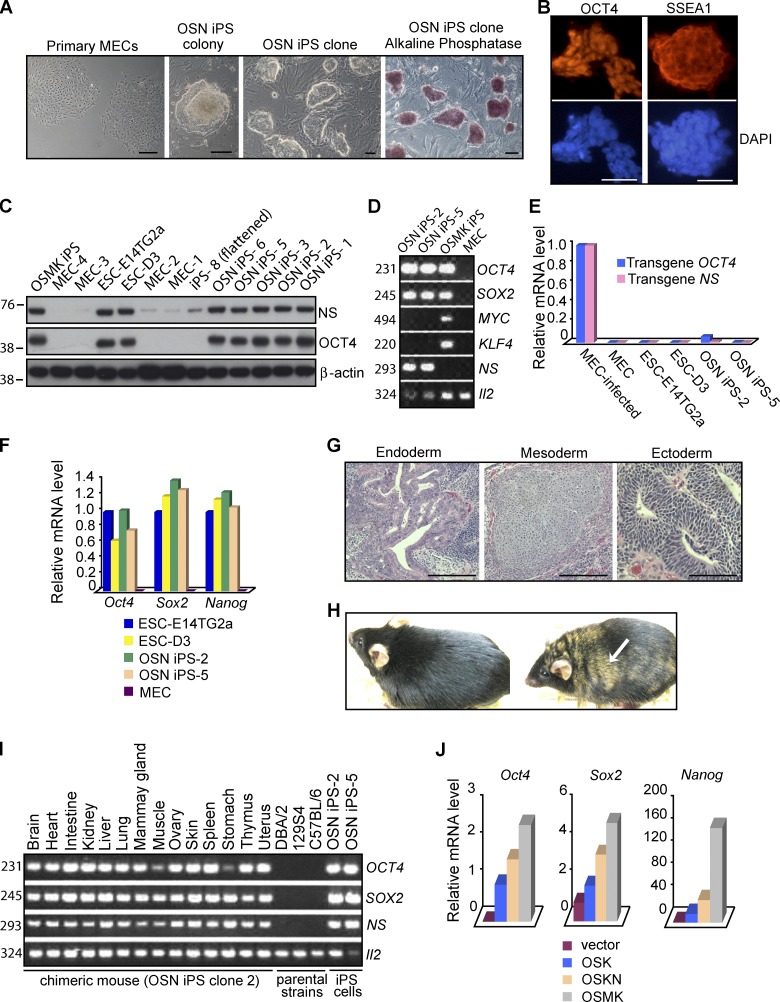
Induction of pluripotent stem cells from mouse mammary epithelial cells by a combination of OCT4, SOX2, and NS. (A) Morphology of primary MECs, primary OSN iPS colony 4 wk after transduction, and established OSN iPS clones, the last displaying both characteristic ESC colony morphology and strong staining for AP activity. (B) Expression of pluripotency markers (OCT4 and SSEA1) in OSN iPS cells, as assessed by immunofluorescence microscopy. Nuclei were counterstained with DAPI. The antibodies used in B and C could recognize both human and mouse homologues, but the data likely represent only endogenous mouse proteins due to silencing of the retroviral vectors. (C) Western analysis of NS and OCT4 proteins in OSN iPS cells, OSMK iPS cells, normal ESCs (E14TG2a and D3), and the MECs used to generate the iPS cells. β-Actin was used as a loading control. The positions of molecular mass standards (in kilodaltons) are shown. (D) Detection of transgenes in iPS cells. Genomic DNA extracted from OSN iPS cells, OSMK iPS cells, and MECs used to generate the iPS cells was analyzed by PCR with a forward primer specific for viral vector sequences and a reverse primer for cDNA sequences of human transgenes. Il-2 was used as an internal control. The sizes of the PCR products in D and I are indicated in base pairs. (E) Silencing of transduced genes in iPS cell lines. Gene expression was assessed by QPCR, using primers specific for the transduced human genes. Analyses were performed on uninfected MECs, MECs 48 h after infection with the retroviral vectors, two lines of ESCs (E14TG2a and D3), and two OSN iPS cell lines. The data were normalized to the expression of Gapdh and represent the average of triplicate QPCR analyses. The data are displayed relative to results with newly infected MECs. For E, F, and J, one of three independent experiments with comparable results is shown. (F) Reactivation of endogenous mouse Oct4, Sox2, and Nanog in OSN iPS cells. Shown is QPCR analysis with primers detecting transcripts from the respective endogenous mouse loci as opposed to the transduced human cDNAs in OSN iPS cells, two lines of ESCs (E14Tg2a and D3), and the MECs used to generate the iPS cells. Results were normalized to the expression of Gapdh and were the average of triplicate QPCR analyses. The data are shown relative to results with E14Tg2a. (G) Hematoxylin and eosin staining of teratomas generated from OSN iPS cells. Shown is a teratoma containing endoderm (gut-like epithelium), mesoderm (cartilage), and ectoderm (neural tissue). (H) Adult chimeric mouse derived from OSN iPS cells by injection into B6XB6D2 F1 (black) 8-cell-stage embryos and transplantation into pseudopregnant mice. The agouti coat color (arrow) originated from OSN iPS cells derived from129S4 mice. A normal C57BL/6 mouse is shown on the left. (I) Tissue distribution of OSN iPS cells in chimeras. Genomic DNA isolated from indicated organs from an adult chimera derived from OSN iPS cells was analyzed by PCR for the presence of transduced genes as in D. (J) QPCR analysis of endogenous pluripotency markers in early reprogramming cells 12 d after the indicated transductions. The data were normalized to the expression of Gapdh and represent the average of triplicate QPCR analyses. For Sox2 and Nanog, the data are displayed relative to results with MECs transduced with empty vector. For Oct4, the data are displayed relative to results with MECs transduced with OSK. Bars, 100 µm.

