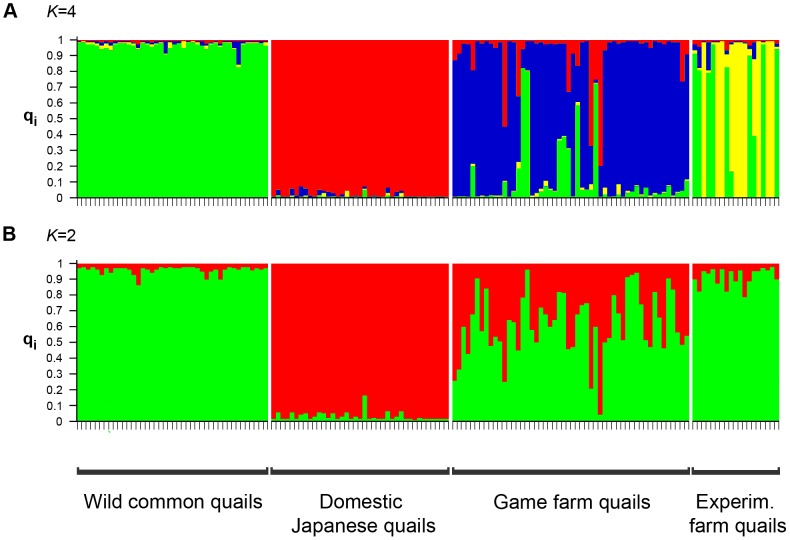
Figure 2. Clustering of individual genotypes into K = 4 (A) or K = 2 (B) clusters according to STRUCTURE.
Each vertical bar represents one individual and clusters are represented by colours. The extent of the colours within each column represents the individual proportion of membership (q) to each one of the clusters.

