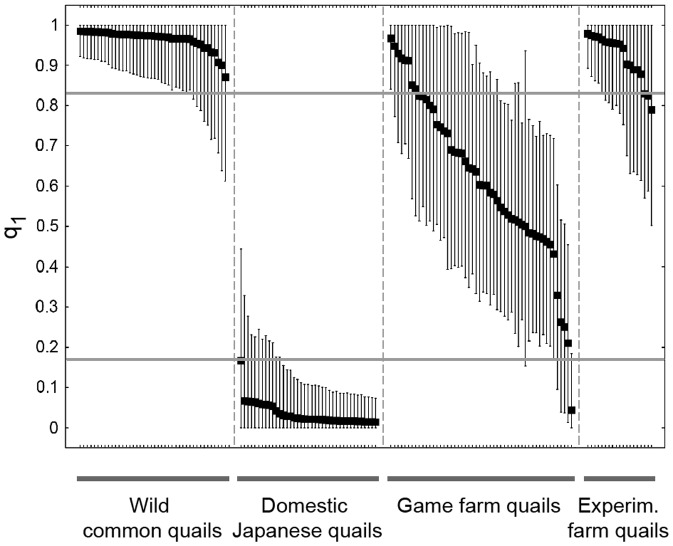
Figure 3. Individual proportion of membership to cluster 1 (q1) and 90% individual probability intervals according to STRUCTURE for K = 2.
The value of q1 indicates membership to the same cluster as wild common quails. Individuals are sorted by group and by q1 value. Probability intervals excluding 0 and 1 are indicative of admixed ancestry. Horizontal lines indicate threshold values for q used for a first separation of pure and admixed individuals (see text).

