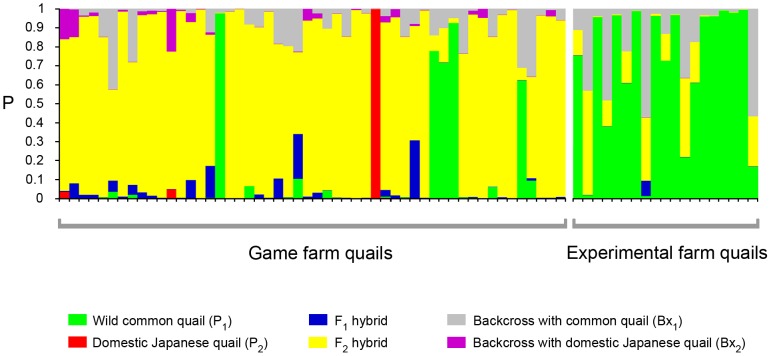
Figure 4. Individual genotype classification according to NEWHYBRIDS.
Each vertical bar represents one individual. Each colour represents the posterior probability (P) of each individual to belong to the six different genotypic classes. Game farm and experimental farm individuals are sorted as in Figure 2.

