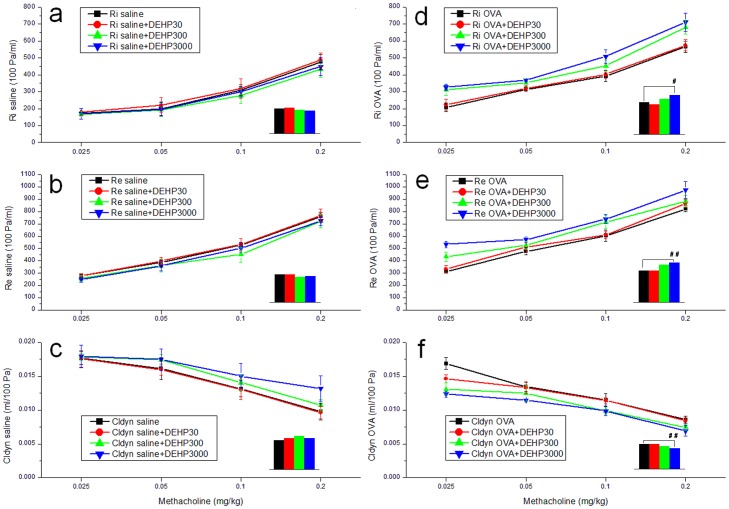
Figure 5. Airway hyperresponsiveness (AHR) measurements in mice.
Covariance analyses (SPSS) were used in these tests. (a) Ri values of saline control and DEHP groups; (b) Re values of saline control and DEHP groups; (c) Cldyn values of saline control and DEHP groups; (d) Ri values of OVA only and OVA+DEHP groups; (e) Re values of OVA only and OVA+DEHP groups; (f) Cldyn values of OVA only and OVA+DEHP groups. Group data were expressed as means±standard deviation (SD).

