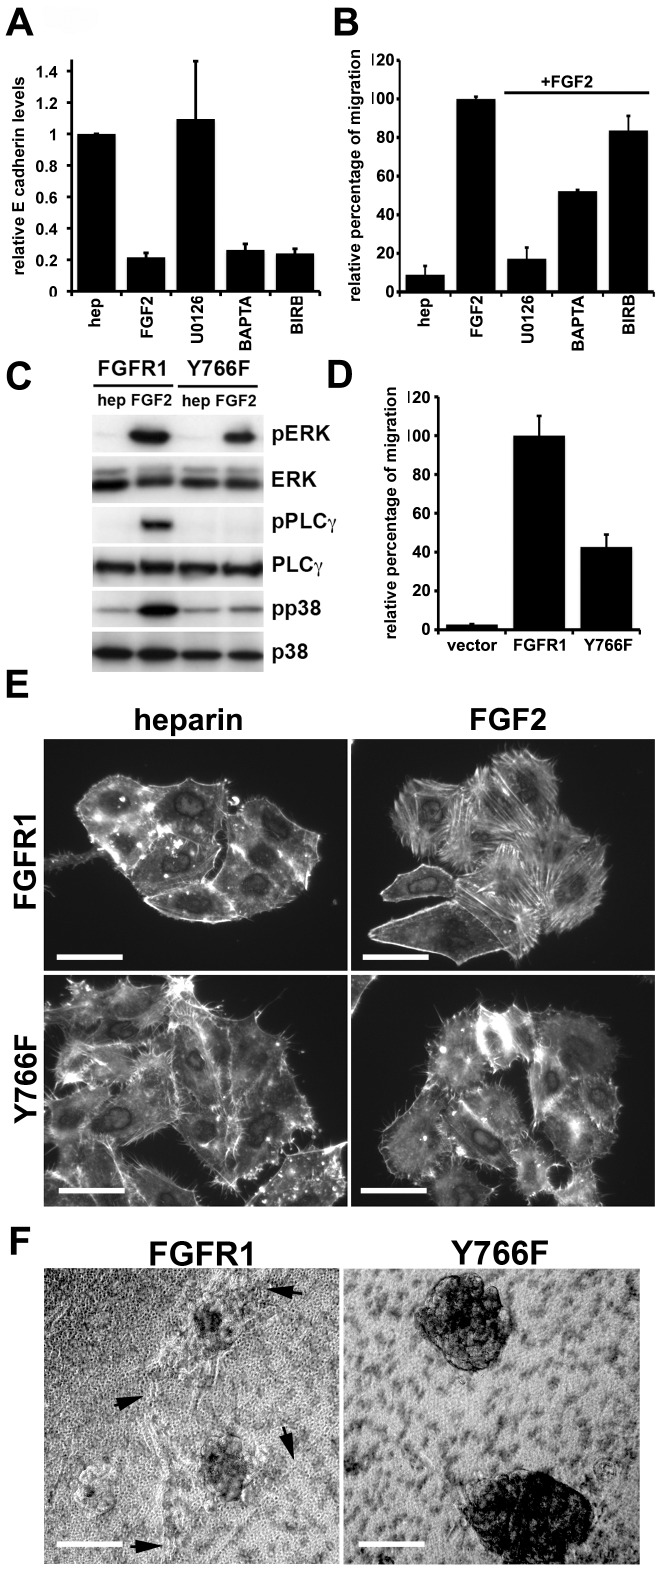
Figure 5. Regulation of E-cadherin and migration.
A. Real time RT-PCR for E-cadherin. levels. 94-10-FR1 cells were cultured in the presence of heparin or heparin and FGF2 with or without U0126, BAPTA-AM or BIRB for 72 h. mRNA was harvested, cDNA made and used for real-time PCR. Levels were normalised to SDHA and standardised to heparin control. B. The effect of the inhibitors on migration was measured by transwell assay. Cells were seeded in the upper chamber, pretreated with inhibitors for 1 hr and fixed and stained after 24 h. Values represent percentage intensity of DAPI stained migrated cells compared to cells cultured with FGF2. C. Western blot showing activation of pathways in 94-10-FR1 and 94-10-Y766F expressing cells. Cells were cultured with either heparin or heparin and FGF2 for 10 min. D. Transwell assay for 94-10 vector control, 94-10-FR1 and 94-10-Y766F cells cultured with heparin and FGF2. Values represent percentage intensity of DAPI stain in the lower chamber compared to 94-10-FR1 cells. E. 94-10-FR1 and 94-10-Y766F cells were cultured with heparin or heparin and FGF2 for 2 h. Cells were stained with DAPI and Phalloidin to examine changes in FGF2-induced actin cytoskeleton (bars = 30 µm). F. FGFR1 and Y766F cells were grown on matrigel in a transwell for 96 h before imaging. FGF2 was used as a chemoattractant in the lower chamber. Arrows indicate regions of invasion (bars = 0.5 mm).

